 |
.Simulation
|
|
.Simulation
|
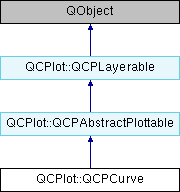
A plottable representing a parametric curve in a plot. More...
Public Types | |
| enum | LineStyle { lsNone, lsLine } |
| Defines how the curve's line is represented visually in the plot. More... | |
Public Member Functions | |
| QCPCurve (QCPAxis *keyAxis, QCPAxis *valueAxis) | |
| Constructs a curve which uses keyAxis as its key axis ("x") and valueAxis as its value axis ("y"). More... | |
| const QCPCurveDataMap * | data () const |
| QCP::ScatterStyle | scatterStyle () const |
| double | scatterSize () const |
| QPixmap | scatterPixmap () const |
| LineStyle | lineStyle () const |
| void | setData (QCPCurveDataMap *data, bool copy=false) |
| Replaces the current data with the provided data. More... | |
| void | setData (const QVector< double > &t, const QVector< double > &key, const QVector< double > &value) |
| This is an overloaded member function, provided for convenience. It differs from the above function only in what argument(s) it accepts.Replaces the current data with the provided points in t, key and value tuples. More... | |
| void | setData (const QVector< double > &key, const QVector< double > &value) |
| This is an overloaded member function, provided for convenience. It differs from the above function only in what argument(s) it accepts.Replaces the current data with the provided key and value pairs. More... | |
| void | setScatterStyle (QCP::ScatterStyle style) |
| Sets the visual appearance of single data points in the plot. More... | |
| void | setScatterSize (double size) |
| This defines how big (in pixels) single scatters are drawn, if scatter style (setScatterStyle) isn't QCP::ssNone, QCP::ssDot or QCP::ssPixmap. More... | |
| void | setScatterPixmap (const QPixmap &pixmap) |
| If the scatter style (setScatterStyle) is set to ssPixmap, this function defines the QPixmap that will be drawn centered on the data point coordinate. More... | |
| void | setLineStyle (LineStyle style) |
| Sets how the single data points are connected in the plot or how they are represented visually apart from the scatter symbol. More... | |
| void | addData (const QCPCurveDataMap &dataMap) |
| Adds the provided data points in dataMap to the current data. More... | |
| void | addData (const QCPCurveData &data) |
| This is an overloaded member function, provided for convenience. It differs from the above function only in what argument(s) it accepts. Adds the provided single data point in data to the current data. More... | |
| void | addData (double t, double key, double value) |
| This is an overloaded member function, provided for convenience. It differs from the above function only in what argument(s) it accepts. Adds the provided single data point as t, key and value tuple to the current data. More... | |
| void | addData (double key, double value) |
| This is an overloaded member function, provided for convenience. It differs from the above function only in what argument(s) it accepts.Adds the provided single data point as key and value pair to the current data The t parameter of the data point is set to the t of the last data point plus 1. More... | |
| void | addData (const QVector< double > &ts, const QVector< double > &keys, const QVector< double > &values) |
| This is an overloaded member function, provided for convenience. It differs from the above function only in what argument(s) it accepts. Adds the provided data points as t, key and value tuples to the current data. More... | |
| void | removeDataBefore (double t) |
| Removes all data points with curve parameter t smaller than t. More... | |
| void | removeDataAfter (double t) |
| Removes all data points with curve parameter t greater than t. More... | |
| void | removeData (double fromt, double tot) |
| Removes all data points with curve parameter t between fromt and tot. More... | |
| void | removeData (double t) |
| This is an overloaded member function, provided for convenience. It differs from the above function only in what argument(s) it accepts.Removes a single data point at curve parameter t. More... | |
| virtual void | clearData () |
| Removes all data points. More... | |
| virtual double | selectTest (const QPointF &pos) const |
| This function is used to decide whether a click hits a plottable or not. More... | |
 Public Member Functions inherited from QCPlot::QCPAbstractPlottable Public Member Functions inherited from QCPlot::QCPAbstractPlottable | |
| QCPAbstractPlottable (QCPAxis *keyAxis, QCPAxis *valueAxis) | |
| Constructs an abstract plottable which uses keyAxis as its key axis ("x") and valueAxis as its value axis ("y"). More... | |
| QString | name () const |
| bool | antialiasedFill () const |
| bool | antialiasedScatters () const |
| bool | antialiasedErrorBars () const |
| QPen | pen () const |
| QPen | selectedPen () const |
| QBrush | brush () const |
| QBrush | selectedBrush () const |
| QCPAxis * | keyAxis () const |
| QCPAxis * | valueAxis () const |
| bool | selectable () const |
| bool | selected () const |
| void | setName (const QString &name) |
| The name is the textual representation of this plottable as it is displayed in the QCPLegend of the parent QCustomPlot. More... | |
| void | setAntialiasedFill (bool enabled) |
| Sets whether fills of this plottable is drawn antialiased or not. More... | |
| void | setAntialiasedScatters (bool enabled) |
| Sets whether the scatter symbols of this plottable are drawn antialiased or not. More... | |
| void | setAntialiasedErrorBars (bool enabled) |
| Sets whether the error bars of this plottable are drawn antialiased or not. More... | |
| void | setPen (const QPen &pen) |
| The pen is used to draw basic lines that make up the plottable representation in the plot. More... | |
| void | setSelectedPen (const QPen &pen) |
| When the plottable is selected, this pen is used to draw basic lines instead of the normal pen set via setPen. More... | |
| void | setBrush (const QBrush &brush) |
| The brush is used to draw basic fills of the plottable representation in the plot. More... | |
| void | setSelectedBrush (const QBrush &brush) |
| When the plottable is selected, this brush is used to draw fills instead of the normal brush set via setBrush. More... | |
| void | setKeyAxis (QCPAxis *axis) |
| The key axis of a plottable can be set to any axis of a QCustomPlot, as long as it is orthogonal to the plottable's value axis. More... | |
| void | setValueAxis (QCPAxis *axis) |
| The value axis of a plottable can be set to any axis of a QCustomPlot, as long as it is orthogonal to the plottable's key axis. More... | |
| void | setSelectable (bool selectable) |
| Sets whether the user can (de-)select this plottable by clicking on the QCustomPlot surface. More... | |
| void | setSelected (bool selected) |
| Sets whether this plottable is selected or not. More... | |
| void | rescaleAxes (bool onlyEnlarge=false) const |
| Rescales the key and value axes associated with this plottable to contain all displayed data, so the whole plottable is visible. More... | |
| void | rescaleKeyAxis (bool onlyEnlarge=false) const |
| Rescales the key axis of the plottable so the whole plottable is visible. More... | |
| void | rescaleValueAxis (bool onlyEnlarge=false) const |
| Rescales the value axis of the plottable so the whole plottable is visible. More... | |
| virtual bool | addToLegend () |
| Adds this plottable to the legend of the parent QCustomPlot. More... | |
| virtual bool | removeFromLegend () const |
| Removes the plottable from the legend of the parent QCustomPlot. More... | |
| Public Member Functions inherited from QCPlot::QCPLayerable | |
| QCPLayerable (QCustomPlot *parentPlot) | |
| Creates a new QCPLayerable instance. More... | |
| bool | visible () const |
| QCustomPlot * | parentPlot () const |
| QCPLayer * | layer () const |
| bool | antialiased () const |
| void | setVisible (bool on) |
| Sets the visibility of this layerable object. More... | |
| bool | setLayer (QCPLayer *layer) |
| Sets the layer of this layerable object. More... | |
| bool | setLayer (const QString &layerName) |
| This is an overloaded member function, provided for convenience. It differs from the above function only in what argument(s) it accepts. Sets the layer of this layerable object by name. More... | |
| void | setAntialiased (bool enabled) |
| Sets whether this object will be drawn antialiased or not. More... | |
Protected Member Functions | |
| virtual void | draw (QCPPainter *painter) |
| virtual void | drawLegendIcon (QCPPainter *painter, const QRect &rect) const |
| virtual void | drawScatterPlot (QCPPainter *painter, const QVector< QPointF > *pointData) const |
| void | getCurveData (QVector< QPointF > *lineData) const |
| double | pointDistance (const QPointF &pixelPoint) const |
| QPointF | outsideCoordsToPixels (double key, double value, int region) const |
| virtual QCPRange | getKeyRange (bool &validRange, SignDomain inSignDomain=sdBoth) const |
| virtual QCPRange | getValueRange (bool &validRange, SignDomain inSignDomain=sdBoth) const |
| Protected Member Functions inherited from QCPlot::QCPAbstractPlottable | |
| virtual QRect | clipRect () const |
| void | coordsToPixels (double key, double value, double &x, double &y) const |
| const QPointF | coordsToPixels (double key, double value) const |
| void | pixelsToCoords (double x, double y, double &key, double &value) const |
| void | pixelsToCoords (const QPointF &pixelPos, double &key, double &value) const |
| QPen | mainPen () const |
| QBrush | mainBrush () const |
| void | applyDefaultAntialiasingHint (QCPPainter *painter) const |
| void | applyFillAntialiasingHint (QCPPainter *painter) const |
| void | applyScattersAntialiasingHint (QCPPainter *painter) const |
| void | applyErrorBarsAntialiasingHint (QCPPainter *painter) const |
| double | distSqrToLine (const QPointF &start, const QPointF &end, const QPointF &point) const |
| Protected Member Functions inherited from QCPlot::QCPLayerable | |
| bool | moveToLayer (QCPLayer *layer, bool prepend) |
| void | applyAntialiasingHint (QCPPainter *painter, bool localAntialiased, QCP::AntialiasedElement overrideElement) const |
Protected Attributes | |
| QCPCurveDataMap * | mData |
| QCP::ScatterStyle | mScatterStyle |
| double | mScatterSize |
| QPixmap | mScatterPixmap |
| LineStyle | mLineStyle |
| Protected Attributes inherited from QCPlot::QCPAbstractPlottable | |
| QString | mName |
| bool | mAntialiasedFill |
| bool | mAntialiasedScatters |
| bool | mAntialiasedErrorBars |
| QPen | mPen |
| QPen | mSelectedPen |
| QBrush | mBrush |
| QBrush | mSelectedBrush |
| QCPAxis * | mKeyAxis |
| QCPAxis * | mValueAxis |
| bool | mSelected |
| bool | mSelectable |
| Protected Attributes inherited from QCPlot::QCPLayerable | |
| bool | mVisible |
| QCustomPlot * | mParentPlot |
| QCPLayer * | mLayer |
| bool | mAntialiased |
Friends | |
| class | QCustomPlot |
| class | QCPLegend |
Additional Inherited Members | |
| Signals inherited from QCPlot::QCPAbstractPlottable | |
| void | selectionChanged (bool selected) |
| This signal is emitted when the selection state of this plottable has changed, either by user interaction or by a direct call to setSelected. | |
| Protected Types inherited from QCPlot::QCPAbstractPlottable | |
| enum | SignDomain { sdNegative, sdBoth, sdPositive } |
| Represents negative and positive sign domain for passing to getKeyRange and getValueRange. More... | |
A plottable representing a parametric curve in a plot.
To plot data, assign it with the setData or addData functions.
The appearance of the curve is determined by the pen and the brush (setPen, setBrush).
Like all data representing objects in QCustomPlot, the QCPCurve is a plottable (QCPAbstractPlottable). So the plottable-interface of QCustomPlot applies (QCustomPlot::plottable, QCustomPlot::addPlottable, QCustomPlot::removePlottable, etc.)
Usually, you first create an instance:
add it to the customPlot with QCustomPlot::addPlottable:
and then modify the properties of the newly created plottable, e.g.:
Defines how the curve's line is represented visually in the plot.
The line is drawn with the current pen of the curve (setPen).
| Enumerator | |
|---|---|
| lsNone |
No line is drawn between data points (e.g. only scatters) |
| lsLine |
Data points are connected with a straight line. |
Constructs a curve which uses keyAxis as its key axis ("x") and valueAxis as its value axis ("y").
keyAxis and valueAxis must reside in the same QCustomPlot instance and not have the same orientation. If either of these restrictions is violated, a corresponding message is printed to the debug output (qDebug), the construction is not aborted, though.
The constructed QCPCurve can be added to the plot with QCustomPlot::addPlottable, QCustomPlot then takes ownership of the graph.
| void QCPlot::QCPCurve::addData | ( | const QCPCurveDataMap & | dataMap | ) |
Adds the provided data points in dataMap to the current data.
| void QCPlot::QCPCurve::addData | ( | const QCPCurveData & | data | ) |
This is an overloaded member function, provided for convenience. It differs from the above function only in what argument(s) it accepts. Adds the provided single data point in data to the current data.
| void QCPlot::QCPCurve::addData | ( | double | t, |
| double | key, | ||
| double | value | ||
| ) |
This is an overloaded member function, provided for convenience. It differs from the above function only in what argument(s) it accepts. Adds the provided single data point as t, key and value tuple to the current data.
| void QCPlot::QCPCurve::addData | ( | double | key, |
| double | value | ||
| ) |
This is an overloaded member function, provided for convenience. It differs from the above function only in what argument(s) it accepts.Adds the provided single data point as key and value pair to the current data The t parameter of the data point is set to the t of the last data point plus 1.
If there is no last data point, t will be set to 0.
| void QCPlot::QCPCurve::addData | ( | const QVector< double > & | ts, |
| const QVector< double > & | keys, | ||
| const QVector< double > & | values | ||
| ) |
This is an overloaded member function, provided for convenience. It differs from the above function only in what argument(s) it accepts. Adds the provided data points as t, key and value tuples to the current data.
|
virtual |
Removes all data points.
Implements QCPlot::QCPAbstractPlottable.
| void QCPlot::QCPCurve::removeData | ( | double | fromt, |
| double | tot | ||
| ) |
Removes all data points with curve parameter t between fromt and tot.
if fromt is greater or equal to tot, the function does nothing. To remove a single data point with known t, use removeData(double t).
| void QCPlot::QCPCurve::removeData | ( | double | t | ) |
This is an overloaded member function, provided for convenience. It differs from the above function only in what argument(s) it accepts.Removes a single data point at curve parameter t.
If the position is not known with absolute precision, consider using removeData(double fromt, double tot) with a small fuzziness interval around the suspected position, depeding on the precision with which the curve parameter is known.
| void QCPlot::QCPCurve::removeDataAfter | ( | double | t | ) |
| void QCPlot::QCPCurve::removeDataBefore | ( | double | t | ) |
|
virtual |
This function is used to decide whether a click hits a plottable or not.
pos is a point in pixel coordinates on the QCustomPlot surface. This function returns the shortest pixel distance of this point to the plottable (e.g. to the scatters/lines of a graph). If the plottable is either invisible, contains no data or the distance couldn't be determined, -1.0 is returned. setSelectable has no influence on the return value of this function.
If the plottable is represented not by single lines but by an area like QCPBars or QCPStatisticalBox, a click inside the area returns a constant value greater zero (typically 99% of the selectionTolerance of the parent QCustomPlot). If the click lies outside the area, this function returns -1.0.
Providing a constant value for area objects allows selecting line objects even when they are obscured by such area objects, by clicking close to the lines (i.e. closer than 0.99*selectionTolerance).
The actual setting of the selection state is not done by this function. This is handled by the parent QCustomPlot when the mouseReleaseEvent occurs.
Implements QCPlot::QCPAbstractPlottable.
| void QCPlot::QCPCurve::setData | ( | QCPCurveDataMap * | data, |
| bool | copy = false |
||
| ) |
Replaces the current data with the provided data.
If copy is set to true, data points in data will only be copied. if false, the plottable takes ownership of the passed data and replaces the internal data pointer with it. This is significantly faster than copying for large datasets.
| void QCPlot::QCPCurve::setData | ( | const QVector< double > & | t, |
| const QVector< double > & | key, | ||
| const QVector< double > & | value | ||
| ) |
This is an overloaded member function, provided for convenience. It differs from the above function only in what argument(s) it accepts.Replaces the current data with the provided points in t, key and value tuples.
The provided vectors should have equal length. Else, the number of added points will be the size of the smallest vector.
| void QCPlot::QCPCurve::setData | ( | const QVector< double > & | key, |
| const QVector< double > & | value | ||
| ) |
This is an overloaded member function, provided for convenience. It differs from the above function only in what argument(s) it accepts.Replaces the current data with the provided key and value pairs.
The t parameter of each data point will be set to the integer index of the respective key/value pair.
| void QCPlot::QCPCurve::setLineStyle | ( | QCPCurve::LineStyle | style | ) |
Sets how the single data points are connected in the plot or how they are represented visually apart from the scatter symbol.
For scatter-only plots, set style to lsNone and setScatterStyle to the desired scatter style.
| void QCPlot::QCPCurve::setScatterPixmap | ( | const QPixmap & | pixmap | ) |
If the scatter style (setScatterStyle) is set to ssPixmap, this function defines the QPixmap that will be drawn centered on the data point coordinate.
| void QCPlot::QCPCurve::setScatterSize | ( | double | size | ) |
This defines how big (in pixels) single scatters are drawn, if scatter style (setScatterStyle) isn't QCP::ssNone, QCP::ssDot or QCP::ssPixmap.
Floating point values are allowed for fine grained control over optical appearance with antialiased painting.
| void QCPlot::QCPCurve::setScatterStyle | ( | QCP::ScatterStyle | style | ) |
Sets the visual appearance of single data points in the plot.
If set to QCP::ssNone, no scatter points are drawn (e.g. for line-only-plots with appropriate line style).
 1.8.5
1.8.5

