 |
.Simulation
|
|
.Simulation
|
The abstract base class for all data representing objects in a plot. More...
Signals | |
| void | selectionChanged (bool selected) |
| This signal is emitted when the selection state of this plottable has changed, either by user interaction or by a direct call to setSelected. | |
Public Member Functions | |
| QCPAbstractPlottable (QCPAxis *keyAxis, QCPAxis *valueAxis) | |
| Constructs an abstract plottable which uses keyAxis as its key axis ("x") and valueAxis as its value axis ("y"). More... | |
| QString | name () const |
| bool | antialiasedFill () const |
| bool | antialiasedScatters () const |
| bool | antialiasedErrorBars () const |
| QPen | pen () const |
| QPen | selectedPen () const |
| QBrush | brush () const |
| QBrush | selectedBrush () const |
| QCPAxis * | keyAxis () const |
| QCPAxis * | valueAxis () const |
| bool | selectable () const |
| bool | selected () const |
| void | setName (const QString &name) |
| The name is the textual representation of this plottable as it is displayed in the QCPLegend of the parent QCustomPlot. More... | |
| void | setAntialiasedFill (bool enabled) |
| Sets whether fills of this plottable is drawn antialiased or not. More... | |
| void | setAntialiasedScatters (bool enabled) |
| Sets whether the scatter symbols of this plottable are drawn antialiased or not. More... | |
| void | setAntialiasedErrorBars (bool enabled) |
| Sets whether the error bars of this plottable are drawn antialiased or not. More... | |
| void | setPen (const QPen &pen) |
| The pen is used to draw basic lines that make up the plottable representation in the plot. More... | |
| void | setSelectedPen (const QPen &pen) |
| When the plottable is selected, this pen is used to draw basic lines instead of the normal pen set via setPen. More... | |
| void | setBrush (const QBrush &brush) |
| The brush is used to draw basic fills of the plottable representation in the plot. More... | |
| void | setSelectedBrush (const QBrush &brush) |
| When the plottable is selected, this brush is used to draw fills instead of the normal brush set via setBrush. More... | |
| void | setKeyAxis (QCPAxis *axis) |
| The key axis of a plottable can be set to any axis of a QCustomPlot, as long as it is orthogonal to the plottable's value axis. More... | |
| void | setValueAxis (QCPAxis *axis) |
| The value axis of a plottable can be set to any axis of a QCustomPlot, as long as it is orthogonal to the plottable's key axis. More... | |
| void | setSelectable (bool selectable) |
| Sets whether the user can (de-)select this plottable by clicking on the QCustomPlot surface. More... | |
| void | setSelected (bool selected) |
| Sets whether this plottable is selected or not. More... | |
| void | rescaleAxes (bool onlyEnlarge=false) const |
| Rescales the key and value axes associated with this plottable to contain all displayed data, so the whole plottable is visible. More... | |
| void | rescaleKeyAxis (bool onlyEnlarge=false) const |
| Rescales the key axis of the plottable so the whole plottable is visible. More... | |
| void | rescaleValueAxis (bool onlyEnlarge=false) const |
| Rescales the value axis of the plottable so the whole plottable is visible. More... | |
| virtual void | clearData ()=0 |
| Clears all data in the plottable. | |
| virtual double | selectTest (const QPointF &pos) const =0 |
| This function is used to decide whether a click hits a plottable or not. More... | |
| virtual bool | addToLegend () |
| Adds this plottable to the legend of the parent QCustomPlot. More... | |
| virtual bool | removeFromLegend () const |
| Removes the plottable from the legend of the parent QCustomPlot. More... | |
 Public Member Functions inherited from QCPlot::QCPLayerable Public Member Functions inherited from QCPlot::QCPLayerable | |
| QCPLayerable (QCustomPlot *parentPlot) | |
| Creates a new QCPLayerable instance. More... | |
| bool | visible () const |
| QCustomPlot * | parentPlot () const |
| QCPLayer * | layer () const |
| bool | antialiased () const |
| void | setVisible (bool on) |
| Sets the visibility of this layerable object. More... | |
| bool | setLayer (QCPLayer *layer) |
| Sets the layer of this layerable object. More... | |
| bool | setLayer (const QString &layerName) |
| This is an overloaded member function, provided for convenience. It differs from the above function only in what argument(s) it accepts. Sets the layer of this layerable object by name. More... | |
| void | setAntialiased (bool enabled) |
| Sets whether this object will be drawn antialiased or not. More... | |
Protected Types | |
| enum | SignDomain { sdNegative, sdBoth, sdPositive } |
| Represents negative and positive sign domain for passing to getKeyRange and getValueRange. More... | |
Protected Member Functions | |
| virtual QRect | clipRect () const |
| virtual void | draw (QCPPainter *painter)=0 |
| virtual void | drawLegendIcon (QCPPainter *painter, const QRect &rect) const =0 |
| virtual QCPRange | getKeyRange (bool &validRange, SignDomain inSignDomain=sdBoth) const =0 |
| virtual QCPRange | getValueRange (bool &validRange, SignDomain inSignDomain=sdBoth) const =0 |
| void | coordsToPixels (double key, double value, double &x, double &y) const |
| const QPointF | coordsToPixels (double key, double value) const |
| void | pixelsToCoords (double x, double y, double &key, double &value) const |
| void | pixelsToCoords (const QPointF &pixelPos, double &key, double &value) const |
| QPen | mainPen () const |
| QBrush | mainBrush () const |
| void | applyDefaultAntialiasingHint (QCPPainter *painter) const |
| void | applyFillAntialiasingHint (QCPPainter *painter) const |
| void | applyScattersAntialiasingHint (QCPPainter *painter) const |
| void | applyErrorBarsAntialiasingHint (QCPPainter *painter) const |
| double | distSqrToLine (const QPointF &start, const QPointF &end, const QPointF &point) const |
| Protected Member Functions inherited from QCPlot::QCPLayerable | |
| bool | moveToLayer (QCPLayer *layer, bool prepend) |
| void | applyAntialiasingHint (QCPPainter *painter, bool localAntialiased, QCP::AntialiasedElement overrideElement) const |
Protected Attributes | |
| QString | mName |
| bool | mAntialiasedFill |
| bool | mAntialiasedScatters |
| bool | mAntialiasedErrorBars |
| QPen | mPen |
| QPen | mSelectedPen |
| QBrush | mBrush |
| QBrush | mSelectedBrush |
| QCPAxis * | mKeyAxis |
| QCPAxis * | mValueAxis |
| bool | mSelected |
| bool | mSelectable |
| Protected Attributes inherited from QCPlot::QCPLayerable | |
| bool | mVisible |
| QCustomPlot * | mParentPlot |
| QCPLayer * | mLayer |
| bool | mAntialiased |
Friends | |
| class | QCustomPlot |
| class | QCPPlottableLegendItem |
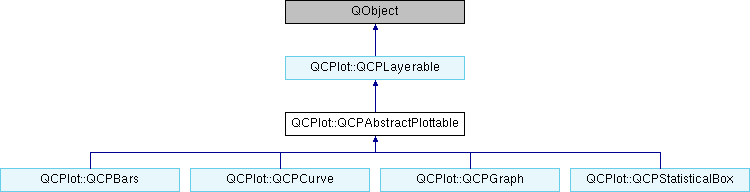
The abstract base class for all data representing objects in a plot.
It defines a very basic interface like name, pen, brush, visibility etc. Since this class is abstract, it can't be instantiated. Use one of the subclasses or create a subclass yourself (see below), to create new ways of displaying data.
All further specifics are in the subclasses, for example:
To create an own plottable, you implement a subclass of QCPAbstractPlottable. These are the pure virtual functions, you must implement:
See the documentation of those functions for what they need to do.
For drawing your plot, you can use the coordsToPixels functions to translate a point in plot coordinates to pixel coordinates. This function is quite convenient, because it takes the orientation of the key and value axes into account for you (x and y are swapped when the key axis is vertical and the value axis horizontal). If you are worried about performance (i.e. you need to translate many points in a loop like QCPGraph), you can directly use QCPAxis::coordToPixel. However, you must then take care about the orientation of the axis yourself.
From QCPAbstractPlottable you inherit the following members you may use:
| QCustomPlot *mParentPlot | A pointer to the parent QCustomPlot instance. This is adopted from the axes that are passed in the constructor. |
| QString mName | The name of the plottable. |
| bool mVisible | Whether the plot is visible or not. When this is false, you shouldn't draw the data in the draw function (draw is always called, no matter what mVisible is). |
| QPen mPen | The generic pen of the plottable. You should use this pen for the most prominent data representing lines in the plottable (e.g QCPGraph uses this pen for its graph lines and scatters) |
| QPen mSelectedPen | The generic pen that should be used when the plottable is selected (hint: mainPen gives you the right pen, depending on selection state). |
| QBrush mBrush | The generic brush of the plottable. You should use this brush for the most prominent fillable structures in the plottable (e.g. QCPGraph uses this brush to control filling under the graph) |
| QBrush mSelectedBrush | The generic brush that should be used when the plottable is selected (hint: mainBrush gives you the right brush, depending on selection state). |
| QCPAxis *mKeyAxis, *mValueAxis | The key and value axes this plottable is attached to. Call their QCPAxis::coordToPixel functions to translate coordinates to pixels in either the key or value dimension. |
| bool mSelected | indicates whether the plottable is selected or not. |
|
protected |
Represents negative and positive sign domain for passing to getKeyRange and getValueRange.
Constructs an abstract plottable which uses keyAxis as its key axis ("x") and valueAxis as its value axis ("y").
keyAxis and valueAxis must reside in the same QCustomPlot instance and not have the same orientation. If either of these restrictions is violated, a corresponding message is printed to the debug output (qDebug), the construction is not aborted, though.
Since QCPAbstractPlottable is an abstract class that defines the basic interface to plottables (i.e. any form of data representation inside a plot, like graphs, curves etc.), it can't be directly instantiated.
You probably want one of the subclasses like QCPGraph and QCPCurve instead.
|
virtual |
Adds this plottable to the legend of the parent QCustomPlot.
Normally, a QCPPlottableLegendItem is created and inserted into the legend. If the plottable needs a more specialized representation in the plot, this function will take this into account and instead create the specialized subclass of QCPAbstractLegendItem.
Returns true on success, i.e. when a legend item associated with this plottable isn't already in the legend.
|
virtual |
Removes the plottable from the legend of the parent QCustomPlot.
This means the QCPAbstractLegendItem (usually a QCPPlottableLegendItem) that is associated with this plottable is removed.
Returns true on success, i.e. if a legend item associated with this plottable was found and removed from the legend.
| void QCPlot::QCPAbstractPlottable::rescaleAxes | ( | bool | onlyEnlarge = false | ) | const |
Rescales the key and value axes associated with this plottable to contain all displayed data, so the whole plottable is visible.
If the scaling of an axis is logarithmic, rescaleAxes will make sure not to rescale to an illegal range i.e. a range containing different signs and/or zero. Instead it will stay in the current sign domain and ignore all parts of the plottable that lie outside of that domain.
onlyEnlarge makes sure the ranges are only expanded, never reduced. So it's possible to show multiple plottables in their entirety by multiple calls to rescaleAxes where the first call has onlyEnlarge set to false (the default), and all subsequent set to true.
| void QCPlot::QCPAbstractPlottable::rescaleKeyAxis | ( | bool | onlyEnlarge = false | ) | const |
Rescales the key axis of the plottable so the whole plottable is visible.
See rescaleAxes for detailed behaviour.
| void QCPlot::QCPAbstractPlottable::rescaleValueAxis | ( | bool | onlyEnlarge = false | ) | const |
Rescales the value axis of the plottable so the whole plottable is visible.
See rescaleAxes for detailed behaviour.
|
pure virtual |
This function is used to decide whether a click hits a plottable or not.
pos is a point in pixel coordinates on the QCustomPlot surface. This function returns the shortest pixel distance of this point to the plottable (e.g. to the scatters/lines of a graph). If the plottable is either invisible, contains no data or the distance couldn't be determined, -1.0 is returned. setSelectable has no influence on the return value of this function.
If the plottable is represented not by single lines but by an area like QCPBars or QCPStatisticalBox, a click inside the area returns a constant value greater zero (typically 99% of the selectionTolerance of the parent QCustomPlot). If the click lies outside the area, this function returns -1.0.
Providing a constant value for area objects allows selecting line objects even when they are obscured by such area objects, by clicking close to the lines (i.e. closer than 0.99*selectionTolerance).
The actual setting of the selection state is not done by this function. This is handled by the parent QCustomPlot when the mouseReleaseEvent occurs.
Implemented in QCPlot::QCPStatisticalBox, QCPlot::QCPBars, QCPlot::QCPCurve, and QCPlot::QCPGraph.
| void QCPlot::QCPAbstractPlottable::setAntialiasedErrorBars | ( | bool | enabled | ) |
Sets whether the error bars of this plottable are drawn antialiased or not.
Note that this setting may be overridden by QCustomPlot::setAntialiasedElements and QCustomPlot::setNotAntialiasedElements.
| void QCPlot::QCPAbstractPlottable::setAntialiasedFill | ( | bool | enabled | ) |
Sets whether fills of this plottable is drawn antialiased or not.
Note that this setting may be overridden by QCustomPlot::setAntialiasedElements and QCustomPlot::setNotAntialiasedElements.
| void QCPlot::QCPAbstractPlottable::setAntialiasedScatters | ( | bool | enabled | ) |
Sets whether the scatter symbols of this plottable are drawn antialiased or not.
Note that this setting may be overridden by QCustomPlot::setAntialiasedElements and QCustomPlot::setNotAntialiasedElements.
| void QCPlot::QCPAbstractPlottable::setBrush | ( | const QBrush & | brush | ) |
| void QCPlot::QCPAbstractPlottable::setKeyAxis | ( | QCPAxis * | axis | ) |
The key axis of a plottable can be set to any axis of a QCustomPlot, as long as it is orthogonal to the plottable's value axis.
This function performs no checks to make sure this is the case. The typical mathematical choice is to use the x-axis (QCustomPlot::xAxis) as key axis and the y-axis (QCustomPlot::yAxis) as value axis.
Normally, the key and value axes are set in the constructor of the plottable (or QCustomPlot::addGraph when working with QCPGraphs through the dedicated graph interface).
| void QCPlot::QCPAbstractPlottable::setName | ( | const QString & | name | ) |
The name is the textual representation of this plottable as it is displayed in the QCPLegend of the parent QCustomPlot.
It may contain any utf-8 characters, including newlines.
| void QCPlot::QCPAbstractPlottable::setPen | ( | const QPen & | pen | ) |
| void QCPlot::QCPAbstractPlottable::setSelectable | ( | bool | selectable | ) |
Sets whether the user can (de-)select this plottable by clicking on the QCustomPlot surface.
(When QCustomPlot::setInteractions contains iSelectPlottables.)
However, even when selectable was set to false, it is possible to set the selection manually, by calling setSelected directly.
| void QCPlot::QCPAbstractPlottable::setSelected | ( | bool | selected | ) |
Sets whether this plottable is selected or not.
When selected, it uses a different pen and brush to draw its lines and fills, see setSelectedPen and setSelectedBrush.
The entire selection mechanism for plottables is handled automatically when QCustomPlot::setInteractions contains iSelectPlottables. You only need to call this function when you wish to change the selection state manually.
This function can change the selection state even when setSelectable was set to false.
emits the selectionChanged signal when selected is different from the previous selection state.
| void QCPlot::QCPAbstractPlottable::setSelectedBrush | ( | const QBrush & | brush | ) |
When the plottable is selected, this brush is used to draw fills instead of the normal brush set via setBrush.
| void QCPlot::QCPAbstractPlottable::setSelectedPen | ( | const QPen & | pen | ) |
When the plottable is selected, this pen is used to draw basic lines instead of the normal pen set via setPen.
| void QCPlot::QCPAbstractPlottable::setValueAxis | ( | QCPAxis * | axis | ) |
The value axis of a plottable can be set to any axis of a QCustomPlot, as long as it is orthogonal to the plottable's key axis.
This function performs no checks to make sure this is the case. The typical mathematical choice is to use the x-axis (QCustomPlot::xAxis) as key axis and the y-axis (QCustomPlot::yAxis) as value axis.
Normally, the key and value axes are set in the constructor of the plottable (or QCustomPlot::addGraph when working with QCPGraphs through the dedicated graph interface).
 1.8.5
1.8.5

