 |
.Simulation
|
|
.Simulation
|
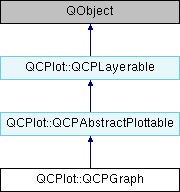
A plottable representing a graph in a plot. More...
Public Types | |
| enum | LineStyle { lsNone, lsLine, lsStepLeft, lsStepRight, lsStepCenter, lsImpulse } |
| Defines how the graph's line is represented visually in the plot. More... | |
| enum | ErrorType { etNone, etKey, etValue, etBoth } |
| Defines what kind of error bars are drawn for each data point. More... | |
Public Member Functions | |
| QCPGraph (QCPAxis *keyAxis, QCPAxis *valueAxis) | |
| Constructs a graph which uses keyAxis as its key axis ("x") and valueAxis as its value axis ("y"). More... | |
| const QCPDataMap * | data () const |
| LineStyle | lineStyle () const |
| QCP::ScatterStyle | scatterStyle () const |
| double | scatterSize () const |
| const QPixmap | scatterPixmap () const |
| ErrorType | errorType () const |
| QPen | errorPen () const |
| double | errorBarSize () const |
| bool | errorBarSkipSymbol () const |
| QCPGraph * | channelFillGraph () const |
| void | setData (QCPDataMap *data, bool copy=false) |
| Replaces the current data with the provided data. More... | |
| void | setData (const QVector< double > &key, const QVector< double > &value) |
| This is an overloaded member function, provided for convenience. It differs from the above function only in what argument(s) it accepts.Replaces the current data with the provided points in key and value pairs. More... | |
| void | setDataKeyError (const QVector< double > &key, const QVector< double > &value, const QVector< double > &keyError) |
| Replaces the current data with the provided points in key and value pairs. More... | |
| void | setDataKeyError (const QVector< double > &key, const QVector< double > &value, const QVector< double > &keyErrorMinus, const QVector< double > &keyErrorPlus) |
| This is an overloaded member function, provided for convenience. It differs from the above function only in what argument(s) it accepts. Replaces the current data with the provided points in key and value pairs. More... | |
| void | setDataValueError (const QVector< double > &key, const QVector< double > &value, const QVector< double > &valueError) |
| Replaces the current data with the provided points in key and value pairs. More... | |
| void | setDataValueError (const QVector< double > &key, const QVector< double > &value, const QVector< double > &valueErrorMinus, const QVector< double > &valueErrorPlus) |
| This is an overloaded member function, provided for convenience. It differs from the above function only in what argument(s) it accepts. Replaces the current data with the provided points in key and value pairs. More... | |
| void | setDataBothError (const QVector< double > &key, const QVector< double > &value, const QVector< double > &keyError, const QVector< double > &valueError) |
| Replaces the current data with the provided points in key and value pairs. More... | |
| void | setDataBothError (const QVector< double > &key, const QVector< double > &value, const QVector< double > &keyErrorMinus, const QVector< double > &keyErrorPlus, const QVector< double > &valueErrorMinus, const QVector< double > &valueErrorPlus) |
| This is an overloaded member function, provided for convenience. It differs from the above function only in what argument(s) it accepts. Replaces the current data with the provided points in key and value pairs. More... | |
| void | setLineStyle (LineStyle ls) |
| Sets how the single data points are connected in the plot or how they are represented visually apart from the scatter symbol. More... | |
| void | setScatterStyle (QCP::ScatterStyle ss) |
| Sets the visual appearance of single data points in the plot. More... | |
| void | setScatterSize (double size) |
| This defines how big (in pixels) single scatters are drawn, if scatter style (setScatterStyle) isn't QCP::ssNone, QCP::ssDot or QCP::ssPixmap. More... | |
| void | setScatterPixmap (const QPixmap &pixmap) |
| If the scatter style (setScatterStyle) is set to ssPixmap, this function defines the QPixmap that will be drawn centered on the data point coordinate. More... | |
| void | setErrorType (ErrorType errorType) |
| Sets which kind of error bars (Key Error, Value Error or both) should be drawn on each data point. More... | |
| void | setErrorPen (const QPen &pen) |
| Sets the pen with which the error bars will be drawn. More... | |
| void | setErrorBarSize (double size) |
| Sets the width of the handles at both ends of an error bar in pixels. | |
| void | setErrorBarSkipSymbol (bool enabled) |
| If enabled is set to true, the error bar will not be drawn as a solid line under the scatter symbol but leave some free space around the symbol. More... | |
| void | setChannelFillGraph (QCPGraph *targetGraph) |
| Sets the target graph for filling the area between this graph and targetGraph with the current brush (setBrush). More... | |
| void | addData (const QCPDataMap &dataMap) |
| Adds the provided data points in dataMap to the current data. More... | |
| void | addData (const QCPData &data) |
| This is an overloaded member function, provided for convenience. It differs from the above function only in what argument(s) it accepts. Adds the provided single data point in data to the current data. More... | |
| void | addData (double key, double value) |
| This is an overloaded member function, provided for convenience. It differs from the above function only in what argument(s) it accepts. Adds the provided single data point as key and value pair to the current data. More... | |
| void | addData (const QVector< double > &keys, const QVector< double > &values) |
| This is an overloaded member function, provided for convenience. It differs from the above function only in what argument(s) it accepts. Adds the provided data points as key and value pairs to the current data. More... | |
| void | removeDataBefore (double key) |
| Removes all data points with keys smaller than key. More... | |
| void | removeDataAfter (double key) |
| Removes all data points with keys greater than key. More... | |
| void | removeData (double fromKey, double toKey) |
| Removes all data points with keys between fromKey and toKey. More... | |
| void | removeData (double key) |
| This is an overloaded member function, provided for convenience. It differs from the above function only in what argument(s) it accepts.Removes a single data point at key. More... | |
| virtual void | clearData () |
| Removes all data points. More... | |
| virtual double | selectTest (const QPointF &pos) const |
| This function is used to decide whether a click hits a plottable or not. More... | |
| virtual void | rescaleAxes (bool onlyEnlarge, bool includeErrorBars) const |
| This is an overloaded member function, provided for convenience. It differs from the above function only in what argument(s) it accepts.Allows to define whether error bars are taken into consideration when determining the new axis range. | |
| virtual void | rescaleKeyAxis (bool onlyEnlarge, bool includeErrorBars) const |
| This is an overloaded member function, provided for convenience. It differs from the above function only in what argument(s) it accepts.Allows to define whether error bars (of kind QCPGraph::etKey) are taken into consideration when determining the new axis range. | |
| virtual void | rescaleValueAxis (bool onlyEnlarge, bool includeErrorBars) const |
| This is an overloaded member function, provided for convenience. It differs from the above function only in what argument(s) it accepts.Allows to define whether error bars (of kind QCPGraph::etValue) are taken into consideration when determining the new axis range. | |
 Public Member Functions inherited from QCPlot::QCPAbstractPlottable Public Member Functions inherited from QCPlot::QCPAbstractPlottable | |
| QCPAbstractPlottable (QCPAxis *keyAxis, QCPAxis *valueAxis) | |
| Constructs an abstract plottable which uses keyAxis as its key axis ("x") and valueAxis as its value axis ("y"). More... | |
| QString | name () const |
| bool | antialiasedFill () const |
| bool | antialiasedScatters () const |
| bool | antialiasedErrorBars () const |
| QPen | pen () const |
| QPen | selectedPen () const |
| QBrush | brush () const |
| QBrush | selectedBrush () const |
| QCPAxis * | keyAxis () const |
| QCPAxis * | valueAxis () const |
| bool | selectable () const |
| bool | selected () const |
| void | setName (const QString &name) |
| The name is the textual representation of this plottable as it is displayed in the QCPLegend of the parent QCustomPlot. More... | |
| void | setAntialiasedFill (bool enabled) |
| Sets whether fills of this plottable is drawn antialiased or not. More... | |
| void | setAntialiasedScatters (bool enabled) |
| Sets whether the scatter symbols of this plottable are drawn antialiased or not. More... | |
| void | setAntialiasedErrorBars (bool enabled) |
| Sets whether the error bars of this plottable are drawn antialiased or not. More... | |
| void | setPen (const QPen &pen) |
| The pen is used to draw basic lines that make up the plottable representation in the plot. More... | |
| void | setSelectedPen (const QPen &pen) |
| When the plottable is selected, this pen is used to draw basic lines instead of the normal pen set via setPen. More... | |
| void | setBrush (const QBrush &brush) |
| The brush is used to draw basic fills of the plottable representation in the plot. More... | |
| void | setSelectedBrush (const QBrush &brush) |
| When the plottable is selected, this brush is used to draw fills instead of the normal brush set via setBrush. More... | |
| void | setKeyAxis (QCPAxis *axis) |
| The key axis of a plottable can be set to any axis of a QCustomPlot, as long as it is orthogonal to the plottable's value axis. More... | |
| void | setValueAxis (QCPAxis *axis) |
| The value axis of a plottable can be set to any axis of a QCustomPlot, as long as it is orthogonal to the plottable's key axis. More... | |
| void | setSelectable (bool selectable) |
| Sets whether the user can (de-)select this plottable by clicking on the QCustomPlot surface. More... | |
| void | setSelected (bool selected) |
| Sets whether this plottable is selected or not. More... | |
| void | rescaleAxes (bool onlyEnlarge=false) const |
| Rescales the key and value axes associated with this plottable to contain all displayed data, so the whole plottable is visible. More... | |
| void | rescaleKeyAxis (bool onlyEnlarge=false) const |
| Rescales the key axis of the plottable so the whole plottable is visible. More... | |
| void | rescaleValueAxis (bool onlyEnlarge=false) const |
| Rescales the value axis of the plottable so the whole plottable is visible. More... | |
| virtual bool | addToLegend () |
| Adds this plottable to the legend of the parent QCustomPlot. More... | |
| virtual bool | removeFromLegend () const |
| Removes the plottable from the legend of the parent QCustomPlot. More... | |
| Public Member Functions inherited from QCPlot::QCPLayerable | |
| QCPLayerable (QCustomPlot *parentPlot) | |
| Creates a new QCPLayerable instance. More... | |
| bool | visible () const |
| QCustomPlot * | parentPlot () const |
| QCPLayer * | layer () const |
| bool | antialiased () const |
| void | setVisible (bool on) |
| Sets the visibility of this layerable object. More... | |
| bool | setLayer (QCPLayer *layer) |
| Sets the layer of this layerable object. More... | |
| bool | setLayer (const QString &layerName) |
| This is an overloaded member function, provided for convenience. It differs from the above function only in what argument(s) it accepts. Sets the layer of this layerable object by name. More... | |
| void | setAntialiased (bool enabled) |
| Sets whether this object will be drawn antialiased or not. More... | |
Protected Member Functions | |
| virtual void | draw (QCPPainter *painter) |
| virtual void | drawLegendIcon (QCPPainter *painter, const QRect &rect) const |
| void | getPlotData (QVector< QPointF > *lineData, QVector< QCPData > *pointData) const |
| void | getScatterPlotData (QVector< QCPData > *pointData) const |
| void | getLinePlotData (QVector< QPointF > *lineData, QVector< QCPData > *pointData) const |
| void | getStepLeftPlotData (QVector< QPointF > *lineData, QVector< QCPData > *pointData) const |
| void | getStepRightPlotData (QVector< QPointF > *lineData, QVector< QCPData > *pointData) const |
| void | getStepCenterPlotData (QVector< QPointF > *lineData, QVector< QCPData > *pointData) const |
| void | getImpulsePlotData (QVector< QPointF > *lineData, QVector< QCPData > *pointData) const |
| void | drawFill (QCPPainter *painter, QVector< QPointF > *lineData) const |
| void | drawScatterPlot (QCPPainter *painter, QVector< QCPData > *pointData) const |
| void | drawLinePlot (QCPPainter *painter, QVector< QPointF > *lineData) const |
| void | drawImpulsePlot (QCPPainter *painter, QVector< QPointF > *lineData) const |
| void | drawError (QCPPainter *painter, double x, double y, const QCPData &data) const |
| void | getVisibleDataBounds (QCPDataMap::const_iterator &lower, QCPDataMap::const_iterator &upper, int &count) const |
| void | addFillBasePoints (QVector< QPointF > *lineData) const |
| void | removeFillBasePoints (QVector< QPointF > *lineData) const |
| QPointF | lowerFillBasePoint (double lowerKey) const |
| QPointF | upperFillBasePoint (double upperKey) const |
| const QPolygonF | getChannelFillPolygon (const QVector< QPointF > *lineData) const |
| int | findIndexBelowX (const QVector< QPointF > *data, double x) const |
| int | findIndexAboveX (const QVector< QPointF > *data, double x) const |
| int | findIndexBelowY (const QVector< QPointF > *data, double y) const |
| int | findIndexAboveY (const QVector< QPointF > *data, double y) const |
| double | pointDistance (const QPointF &pixelPoint) const |
| virtual QCPRange | getKeyRange (bool &validRange, SignDomain inSignDomain=sdBoth) const |
| virtual QCPRange | getValueRange (bool &validRange, SignDomain inSignDomain=sdBoth) const |
| virtual QCPRange | getKeyRange (bool &validRange, SignDomain inSignDomain, bool includeErrors) const |
| This is an overloaded member function, provided for convenience. It differs from the above function only in what argument(s) it accepts. Allows to specify whether the error bars should be included in the range calculation. More... | |
| virtual QCPRange | getValueRange (bool &validRange, SignDomain inSignDomain, bool includeErrors) const |
| This is an overloaded member function, provided for convenience. It differs from the above function only in what argument(s) it accepts. Allows to specify whether the error bars should be included in the range calculation. More... | |
| Protected Member Functions inherited from QCPlot::QCPAbstractPlottable | |
| virtual QRect | clipRect () const |
| void | coordsToPixels (double key, double value, double &x, double &y) const |
| const QPointF | coordsToPixels (double key, double value) const |
| void | pixelsToCoords (double x, double y, double &key, double &value) const |
| void | pixelsToCoords (const QPointF &pixelPos, double &key, double &value) const |
| QPen | mainPen () const |
| QBrush | mainBrush () const |
| void | applyDefaultAntialiasingHint (QCPPainter *painter) const |
| void | applyFillAntialiasingHint (QCPPainter *painter) const |
| void | applyScattersAntialiasingHint (QCPPainter *painter) const |
| void | applyErrorBarsAntialiasingHint (QCPPainter *painter) const |
| double | distSqrToLine (const QPointF &start, const QPointF &end, const QPointF &point) const |
| Protected Member Functions inherited from QCPlot::QCPLayerable | |
| bool | moveToLayer (QCPLayer *layer, bool prepend) |
| void | applyAntialiasingHint (QCPPainter *painter, bool localAntialiased, QCP::AntialiasedElement overrideElement) const |
Protected Attributes | |
| QCPDataMap * | mData |
| QPen | mErrorPen |
| LineStyle | mLineStyle |
| QCP::ScatterStyle | mScatterStyle |
| double | mScatterSize |
| QPixmap | mScatterPixmap |
| ErrorType | mErrorType |
| double | mErrorBarSize |
| bool | mErrorBarSkipSymbol |
| QCPGraph * | mChannelFillGraph |
| Protected Attributes inherited from QCPlot::QCPAbstractPlottable | |
| QString | mName |
| bool | mAntialiasedFill |
| bool | mAntialiasedScatters |
| bool | mAntialiasedErrorBars |
| QPen | mPen |
| QPen | mSelectedPen |
| QBrush | mBrush |
| QBrush | mSelectedBrush |
| QCPAxis * | mKeyAxis |
| QCPAxis * | mValueAxis |
| bool | mSelected |
| bool | mSelectable |
| Protected Attributes inherited from QCPlot::QCPLayerable | |
| bool | mVisible |
| QCustomPlot * | mParentPlot |
| QCPLayer * | mLayer |
| bool | mAntialiased |
Friends | |
| class | QCustomPlot |
| class | QCPLegend |
Additional Inherited Members | |
| Signals inherited from QCPlot::QCPAbstractPlottable | |
| void | selectionChanged (bool selected) |
| This signal is emitted when the selection state of this plottable has changed, either by user interaction or by a direct call to setSelected. | |
| Protected Types inherited from QCPlot::QCPAbstractPlottable | |
| enum | SignDomain { sdNegative, sdBoth, sdPositive } |
| Represents negative and positive sign domain for passing to getKeyRange and getValueRange. More... | |
A plottable representing a graph in a plot.
Usually QCustomPlot creates it internally via QCustomPlot::addGraph and the resulting instance is accessed via QCustomPlot::graph.
To plot data, assign it with the setData or addData functions.
The appearance of the graph is mainly determined by the line style, scatter style, brush and pen of the graph (setLineStyle, setScatterStyle, setBrush, setPen).
QCPGraph knows two types of fills: Normal graph fills towards the zero-value-line parallel to the key axis of the graph, and fills between two graphs, called channel fills. To enable a fill, just set a brush with setBrush which is neither Qt::NoBrush nor fully transparent.
By default, a normal fill towards the zero-value-line will be drawn. To set up a channel fill between this graph and another one, call setChannelFillGraph with the other graph as parameter.
Defines what kind of error bars are drawn for each data point.
Defines how the graph's line is represented visually in the plot.
The line is drawn with the current pen of the graph (setPen).
| Enumerator | |
|---|---|
| lsNone |
data points are not connected with any lines (e.g. data only represented < with symbols according to the scatter style, see setScatterStyle) |
| lsLine |
data points are connected by a straight line |
| lsStepLeft |
line is drawn as steps where the step height is the value of the left data point |
| lsStepRight |
line is drawn as steps where the step height is the value of the right data point |
| lsStepCenter |
line is drawn as steps where the step is in between two data points |
| lsImpulse |
each data point is represented by a line parallel to the value axis, which reaches from the data point to the zero-value-line |
Constructs a graph which uses keyAxis as its key axis ("x") and valueAxis as its value axis ("y").
keyAxis and valueAxis must reside in the same QCustomPlot instance and not have the same orientation. If either of these restrictions is violated, a corresponding message is printed to the debug output (qDebug), the construction is not aborted, though.
The constructed QCPGraph can be added to the plot with QCustomPlot::addPlottable, QCustomPlot then takes ownership of the graph.
To directly create a graph inside a plot, you can also use the simpler QCustomPlot::addGraph function.
| void QCPlot::QCPGraph::addData | ( | const QCPDataMap & | dataMap | ) |
Adds the provided data points in dataMap to the current data.
| void QCPlot::QCPGraph::addData | ( | const QCPData & | data | ) |
This is an overloaded member function, provided for convenience. It differs from the above function only in what argument(s) it accepts. Adds the provided single data point in data to the current data.
| void QCPlot::QCPGraph::addData | ( | double | key, |
| double | value | ||
| ) |
This is an overloaded member function, provided for convenience. It differs from the above function only in what argument(s) it accepts. Adds the provided single data point as key and value pair to the current data.
| void QCPlot::QCPGraph::addData | ( | const QVector< double > & | keys, |
| const QVector< double > & | values | ||
| ) |
This is an overloaded member function, provided for convenience. It differs from the above function only in what argument(s) it accepts. Adds the provided data points as key and value pairs to the current data.
|
virtual |
Removes all data points.
Implements QCPlot::QCPAbstractPlottable.
|
protectedvirtual |
This is an overloaded member function, provided for convenience. It differs from the above function only in what argument(s) it accepts. Allows to specify whether the error bars should be included in the range calculation.
|
protectedvirtual |
This is an overloaded member function, provided for convenience. It differs from the above function only in what argument(s) it accepts. Allows to specify whether the error bars should be included in the range calculation.
| void QCPlot::QCPGraph::removeData | ( | double | fromKey, |
| double | toKey | ||
| ) |
Removes all data points with keys between fromKey and toKey.
if fromKey is greater or equal to toKey, the function does nothing. To remove a single data point with known key, use removeData(double key).
| void QCPlot::QCPGraph::removeData | ( | double | key | ) |
This is an overloaded member function, provided for convenience. It differs from the above function only in what argument(s) it accepts.Removes a single data point at key.
If the position is not known with absolute precision, consider using removeData(double fromKey, double toKey) with a small fuzziness interval around the suspected position, depeding on the precision with which the key is known.
| void QCPlot::QCPGraph::removeDataAfter | ( | double | key | ) |
| void QCPlot::QCPGraph::removeDataBefore | ( | double | key | ) |
|
virtual |
This function is used to decide whether a click hits a plottable or not.
pos is a point in pixel coordinates on the QCustomPlot surface. This function returns the shortest pixel distance of this point to the plottable (e.g. to the scatters/lines of a graph). If the plottable is either invisible, contains no data or the distance couldn't be determined, -1.0 is returned. setSelectable has no influence on the return value of this function.
If the plottable is represented not by single lines but by an area like QCPBars or QCPStatisticalBox, a click inside the area returns a constant value greater zero (typically 99% of the selectionTolerance of the parent QCustomPlot). If the click lies outside the area, this function returns -1.0.
Providing a constant value for area objects allows selecting line objects even when they are obscured by such area objects, by clicking close to the lines (i.e. closer than 0.99*selectionTolerance).
The actual setting of the selection state is not done by this function. This is handled by the parent QCustomPlot when the mouseReleaseEvent occurs.
Implements QCPlot::QCPAbstractPlottable.
| void QCPlot::QCPGraph::setChannelFillGraph | ( | QCPGraph * | targetGraph | ) |
Sets the target graph for filling the area between this graph and targetGraph with the current brush (setBrush).
When targetGraph is set to 0, a normal graph fill will be produced. This means, when the brush is not Qt::NoBrush or fully transparent, a fill all the way to the zero-value-line parallel to the key axis of this graph will be drawn. To disable any filling, set the brush to Qt::NoBrush.
| void QCPlot::QCPGraph::setData | ( | QCPDataMap * | data, |
| bool | copy = false |
||
| ) |
Replaces the current data with the provided data.
If copy is set to true, data points in data will only be copied. if false, the graph takes ownership of the passed data and replaces the internal data pointer with it. This is significantly faster than copying for large datasets.
| void QCPlot::QCPGraph::setData | ( | const QVector< double > & | key, |
| const QVector< double > & | value | ||
| ) |
This is an overloaded member function, provided for convenience. It differs from the above function only in what argument(s) it accepts.Replaces the current data with the provided points in key and value pairs.
The provided vectors should have equal length. Else, the number of added points will be the size of the smallest vector.
| void QCPlot::QCPGraph::setDataBothError | ( | const QVector< double > & | key, |
| const QVector< double > & | value, | ||
| const QVector< double > & | keyError, | ||
| const QVector< double > & | valueError | ||
| ) |
Replaces the current data with the provided points in key and value pairs.
Additionally the symmetrical key and value errors of the data points are set to the values in keyError and valueError. For error bars to show appropriately, see setErrorType. The provided vectors should have equal length. Else, the number of added points will be the size of the smallest vector.
For asymmetrical errors (plus different from minus), see the overloaded version of this function.
| void QCPlot::QCPGraph::setDataBothError | ( | const QVector< double > & | key, |
| const QVector< double > & | value, | ||
| const QVector< double > & | keyErrorMinus, | ||
| const QVector< double > & | keyErrorPlus, | ||
| const QVector< double > & | valueErrorMinus, | ||
| const QVector< double > & | valueErrorPlus | ||
| ) |
This is an overloaded member function, provided for convenience. It differs from the above function only in what argument(s) it accepts. Replaces the current data with the provided points in key and value pairs.
Additionally the negative key and value errors of the data points are set to the values in keyErrorMinus and valueErrorMinus. The positive key and value errors are set to the values in keyErrorPlus valueErrorPlus. For error bars to show appropriately, see setErrorType. The provided vectors should have equal length. Else, the number of added points will be the size of the smallest vector.
| void QCPlot::QCPGraph::setDataKeyError | ( | const QVector< double > & | key, |
| const QVector< double > & | value, | ||
| const QVector< double > & | keyError | ||
| ) |
Replaces the current data with the provided points in key and value pairs.
Additionally the symmetrical key error of the data points are set to the values in keyError. For error bars to show appropriately, see setErrorType. The provided vectors should have equal length. Else, the number of added points will be the size of the smallest vector.
For asymmetrical errors (plus different from minus), see the overloaded version of this function.
| void QCPlot::QCPGraph::setDataKeyError | ( | const QVector< double > & | key, |
| const QVector< double > & | value, | ||
| const QVector< double > & | keyErrorMinus, | ||
| const QVector< double > & | keyErrorPlus | ||
| ) |
This is an overloaded member function, provided for convenience. It differs from the above function only in what argument(s) it accepts. Replaces the current data with the provided points in key and value pairs.
Additionally the negative key error of the data points are set to the values in keyErrorMinus, the positive key error to keyErrorPlus. For error bars to show appropriately, see setErrorType. The provided vectors should have equal length. Else, the number of added points will be the size of the smallest vector.
| void QCPlot::QCPGraph::setDataValueError | ( | const QVector< double > & | key, |
| const QVector< double > & | value, | ||
| const QVector< double > & | valueError | ||
| ) |
Replaces the current data with the provided points in key and value pairs.
Additionally the symmetrical value error of the data points are set to the values in valueError. For error bars to show appropriately, see setErrorType. The provided vectors should have equal length. Else, the number of added points will be the size of the smallest vector.
For asymmetrical errors (plus different from minus), see the overloaded version of this function.
| void QCPlot::QCPGraph::setDataValueError | ( | const QVector< double > & | key, |
| const QVector< double > & | value, | ||
| const QVector< double > & | valueErrorMinus, | ||
| const QVector< double > & | valueErrorPlus | ||
| ) |
This is an overloaded member function, provided for convenience. It differs from the above function only in what argument(s) it accepts. Replaces the current data with the provided points in key and value pairs.
Additionally the negative value error of the data points are set to the values in valueErrorMinus, the positive value error to valueErrorPlus. For error bars to show appropriately, see setErrorType. The provided vectors should have equal length. Else, the number of added points will be the size of the smallest vector.
| void QCPlot::QCPGraph::setErrorBarSkipSymbol | ( | bool | enabled | ) |
If enabled is set to true, the error bar will not be drawn as a solid line under the scatter symbol but leave some free space around the symbol.
This feature uses the current scatter size (setScatterSize) to determine the size of the area to leave blank. So when drawing Pixmaps as scatter points (QCP::ssPixmap), the scatter size must be set manually to a value corresponding to the size of the Pixmap, if the error bars should leave gaps to its boundaries.
| void QCPlot::QCPGraph::setErrorPen | ( | const QPen & | pen | ) |
Sets the pen with which the error bars will be drawn.
| void QCPlot::QCPGraph::setErrorType | ( | ErrorType | errorType | ) |
Sets which kind of error bars (Key Error, Value Error or both) should be drawn on each data point.
If you set errorType to something other than etNone, make sure to actually pass error data via the specific setData functions along with the data points (e.g. setDataValueError, setDataKeyError, setDataBothError).
| void QCPlot::QCPGraph::setLineStyle | ( | LineStyle | ls | ) |
Sets how the single data points are connected in the plot or how they are represented visually apart from the scatter symbol.
For scatter-only plots, set ls to lsNone and setScatterStyle to the desired scatter style.
| void QCPlot::QCPGraph::setScatterPixmap | ( | const QPixmap & | pixmap | ) |
If the scatter style (setScatterStyle) is set to ssPixmap, this function defines the QPixmap that will be drawn centered on the data point coordinate.
| void QCPlot::QCPGraph::setScatterSize | ( | double | size | ) |
This defines how big (in pixels) single scatters are drawn, if scatter style (setScatterStyle) isn't QCP::ssNone, QCP::ssDot or QCP::ssPixmap.
Floating point values are allowed for fine grained control over optical appearance with antialiased painting.
| void QCPlot::QCPGraph::setScatterStyle | ( | QCP::ScatterStyle | ss | ) |
Sets the visual appearance of single data points in the plot.
If set to QCP::ssNone, no scatter points are drawn (e.g. for line-only-plots with appropriate line style).
 1.8.5
1.8.5

