 |
.Simulation
|
|
.Simulation
|
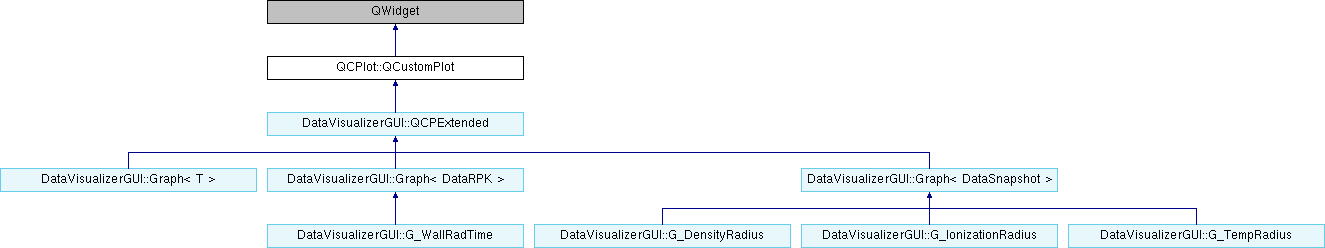
The central class of the library, the QWidget which displays the plot and interacts with the user. More...
Public Types | |
| enum | Interaction { iRangeDrag = 0x001, iRangeZoom = 0x002, iMultiSelect = 0x004, iSelectTitle = 0x008, iSelectPlottables = 0x010, iSelectAxes = 0x020, iSelectLegend = 0x040, iSelectItems = 0x080 } |
| Defines the mouse interactions possible with QCustomPlot. More... | |
| enum | LayerInsertMode { limBelow, limAbove } |
| Defines how a layer should be inserted relative to a specified other layer. More... | |
Public Slots | |
| void | deselectAll () |
| Deselects everything in the QCustomPlot (plottables, items, axes, legend and title). More... | |
| void | replot () |
| Causes a complete replot (axes, labels, graphs, etc.) into the internal buffer. More... | |
| void | rescaleAxes () |
| Rescales the axes such that all plottables (e.g. More... | |
Signals | |
| void | mouseDoubleClick (QMouseEvent *event) |
| This signal is emitted when the QCustomPlot receives a mouse double click event. | |
| void | mousePress (QMouseEvent *event) |
| This signal is emitted when the QCustomPlot receives a mouse press event. More... | |
| void | mouseMove (QMouseEvent *event) |
| This signal is emitted when the QCustomPlot receives a mouse move event. More... | |
| void | mouseRelease (QMouseEvent *event) |
| This signal is emitted when the QCustomPlot receives a mouse release event. More... | |
| void | mouseWheel (QWheelEvent *event) |
| This signal is emitted when the QCustomPlot receives a mouse wheel event. More... | |
| void | plottableClick (QCPAbstractPlottable *plottable, QMouseEvent *event) |
| This signal is emitted when a plottable is clicked. More... | |
| void | plottableDoubleClick (QCPAbstractPlottable *plottable, QMouseEvent *event) |
| This signal is emitted when a plottable is double clicked. More... | |
| void | itemClick (QCPAbstractItem *item, QMouseEvent *event) |
| This signal is emitted when an item is clicked. More... | |
| void | itemDoubleClick (QCPAbstractItem *item, QMouseEvent *event) |
| This signal is emitted when an item is double clicked. More... | |
| void | axisClick (QCPAxis *axis, QCPAxis::SelectablePart part, QMouseEvent *event) |
| This signal is emitted when an axis is clicked. More... | |
| void | axisDoubleClick (QCPAxis *axis, QCPAxis::SelectablePart part, QMouseEvent *event) |
| This signal is emitted when an axis is double clicked. More... | |
| void | legendClick (QCPLegend *legend, QCPAbstractLegendItem *item, QMouseEvent *event) |
| This signal is emitted when a legend (item) is clicked. More... | |
| void | legendDoubleClick (QCPLegend *legend, QCPAbstractLegendItem *item, QMouseEvent *event) |
| This signal is emitted when a legend (item) is double clicked. More... | |
| void | titleClick (QMouseEvent *event) |
| This signal is emitted when the plot title is clicked. More... | |
| void | titleDoubleClick (QMouseEvent *event) |
| This signal is emitted when the plot title is double clicked. More... | |
| void | selectionChangedByUser () |
| This signal is emitted after the user has changed the selection in the QCustomPlot, e.g. More... | |
| void | beforeReplot () |
| This signal is emitted immediately before a replot takes place (caused by a call to the slot replot). More... | |
| void | afterReplot () |
| This signal is emitted immediately after a replot has taken place (caused by a call to the slot replot). More... | |
Public Member Functions | |
| QCustomPlot (QWidget *parent=0) | |
| Constructs a QCustomPlot and sets reasonable default values. More... | |
| QString | title () const |
| QFont | titleFont () const |
| QColor | titleColor () const |
| QRect | axisRect () const |
| QRect | viewport () const |
| Returns the viewport rect of this QCustomPlot instance. More... | |
| int | marginLeft () const |
| int | marginRight () const |
| int | marginTop () const |
| int | marginBottom () const |
| bool | autoMargin () const |
| QColor | color () const |
| Qt::Orientations | rangeDrag () const |
| Qt::Orientations | rangeZoom () const |
| QCPAxis * | rangeDragAxis (Qt::Orientation orientation) |
| Returns the range drag axis of the orientation provided. More... | |
| QCPAxis * | rangeZoomAxis (Qt::Orientation orientation) |
| Returns the range zoom axis of the orientation provided. More... | |
| double | rangeZoomFactor (Qt::Orientation orientation) |
| Returns the range zoom factor of the orientation provided. More... | |
| QCP::AntialiasedElements | antialiasedElements () const |
| QCP::AntialiasedElements | notAntialiasedElements () const |
| bool | autoAddPlottableToLegend () const |
| QPixmap | axisBackground () const |
| bool | axisBackgroundScaled () const |
| Qt::AspectRatioMode | axisBackgroundScaledMode () const |
| const Interactions | interactions () const |
| int | selectionTolerance () const |
| QFont | selectedTitleFont () const |
| QColor | selectedTitleColor () const |
| bool | titleSelected () const |
| bool | noAntialiasingOnDrag () const |
| QCP::PlottingHints | plottingHints () const |
| Qt::KeyboardModifier | multiSelectModifier () const |
| void | setTitle (const QString &title) |
| Sets the plot title which will be drawn centered at the top of the widget. More... | |
| void | setTitleFont (const QFont &font) |
| Sets the font of the plot title. More... | |
| void | setTitleColor (const QColor &color) |
| Sets the text color of the plot title. More... | |
| void | setAxisRect (const QRect &arect) |
| An alternative way to set the margins, by directly setting the wanted axis rect. More... | |
| void | setMarginLeft (int margin) |
| Sets the left margin manually. More... | |
| void | setMarginRight (int margin) |
| Sets the right margin manually. More... | |
| void | setMarginTop (int margin) |
| Sets the top margin manually. More... | |
| void | setMarginBottom (int margin) |
| Sets the bottom margin manually. More... | |
| void | setMargin (int left, int right, int top, int bottom) |
| Sets the margins manually. More... | |
| void | setAutoMargin (bool enabled) |
| Sets whether the margins are calculated automatically depeding on the sizes of the tick labels, axis labels, paddings etc. More... | |
| void | setColor (const QColor &color) |
| Sets the background color of the QCustomPlot widget. | |
| void | setRangeDrag (Qt::Orientations orientations) |
| Sets which axis orientation may be range dragged by the user with mouse interaction. More... | |
| void | setRangeZoom (Qt::Orientations orientations) |
| Sets which axis orientation may be zoomed by the user with the mouse wheel. More... | |
| void | setRangeDragAxes (QCPAxis *horizontal, QCPAxis *vertical) |
| Sets the axes whose range will be dragged when setRangeDrag enables mouse range dragging on the QCustomPlot widget. More... | |
| void | setRangeZoomAxes (QCPAxis *horizontal, QCPAxis *vertical) |
| Sets the axes whose range will be zoomed when setRangeZoom enables mouse wheel zooming on the QCustomPlot widget. More... | |
| void | setRangeZoomFactor (double horizontalFactor, double verticalFactor) |
| Sets how strong one rotation step of the mouse wheel zooms, when range zoom was activated with setRangeZoom. More... | |
| void | setRangeZoomFactor (double factor) |
| This is an overloaded member function, provided for convenience. It differs from the above function only in what argument(s) it accepts.Sets both the horizontal and vertical zoom factor. | |
| void | setAntialiasedElements (const QCP::AntialiasedElements &antialiasedElements) |
| Sets which elements are forcibly drawn antialiased as an or combination of QCP::AntialiasedElement. More... | |
| void | setAntialiasedElement (QCP::AntialiasedElement antialiasedElement, bool enabled=true) |
| Sets whether the specified antialiasedElement is forcibly drawn antialiased. More... | |
| void | setNotAntialiasedElements (const QCP::AntialiasedElements ¬AntialiasedElements) |
| Sets which elements are forcibly drawn not antialiased as an or combination of QCP::AntialiasedElement. More... | |
| void | setNotAntialiasedElement (QCP::AntialiasedElement notAntialiasedElement, bool enabled=true) |
| Sets whether the specified notAntialiasedElement is forcibly drawn not antialiased. More... | |
| void | setAutoAddPlottableToLegend (bool on) |
| If set to true, adding a plottable (e.g. More... | |
| void | setAxisBackground (const QPixmap &pm) |
| Sets pm as the axis background pixmap. More... | |
| void | setAxisBackground (const QPixmap &pm, bool scaled, Qt::AspectRatioMode mode=Qt::KeepAspectRatioByExpanding) |
| This is an overloaded member function, provided for convenience. It differs from the above function only in what argument(s) it accepts. Allows setting the background pixmap, whether it shall be scaled and how it shall be scaled in one call. More... | |
| void | setAxisBackgroundScaled (bool scaled) |
| Sets whether the axis background pixmap shall be scaled to fit the current axis rect or not. More... | |
| void | setAxisBackgroundScaledMode (Qt::AspectRatioMode mode) |
| If scaling of the axis background pixmap is enabled (setAxisBackgroundScaled), use this function to define whether and how the aspect ratio of the original pixmap passed to setAxisBackground is preserved. More... | |
| void | setInteractions (const Interactions &interactions) |
| Sets the possible interactions of this QCustomPlot as an or-combination of Interaction enums. More... | |
| void | setInteraction (const Interaction &interaction, bool enabled=true) |
| Sets the single interaction of this QCustomPlot to enabled. More... | |
| void | setSelectionTolerance (int pixels) |
| Sets the tolerance that is used when deciding whether a click on the QCustomPlot surface selects an object (e.g. More... | |
| void | setSelectedTitleFont (const QFont &font) |
| This font is used to draw the title, when it is selected. More... | |
| void | setSelectedTitleColor (const QColor &color) |
| This color is used to draw the title, when it is selected. More... | |
| void | setTitleSelected (bool selected) |
| Sets whether the plot title is selected. More... | |
| void | setNoAntialiasingOnDrag (bool enabled) |
| Sets whether antialiasing is disabled for all elements while the user is dragging axes ranges. More... | |
| void | setPlottingHints (const QCP::PlottingHints &hints) |
| Sets the plotting hints for this QCustomPlot instance. More... | |
| void | setPlottingHint (QCP::PlottingHint hint, bool enabled=true) |
| Sets the specified plotting hint to enabled. More... | |
| void | setMultiSelectModifier (Qt::KeyboardModifier modifier) |
| Sets the keyboard modifier that will be recognized as multi-select-modifier. More... | |
| QCPAbstractPlottable * | plottable (int index) |
| Returns the plottable with index. More... | |
| QCPAbstractPlottable * | plottable () |
| This is an overloaded member function, provided for convenience. It differs from the above function only in what argument(s) it accepts.Returns the last plottable, that was added with addPlottable. More... | |
| bool | addPlottable (QCPAbstractPlottable *plottable) |
| Adds the specified plottable to the plot and, if setAutoAddPlottableToLegend is enabled, to the legend. More... | |
| bool | removePlottable (QCPAbstractPlottable *plottable) |
| Removes the specified plottable from the plot and, if necessary, from the legend. More... | |
| bool | removePlottable (int index) |
| This is an overloaded member function, provided for convenience. It differs from the above function only in what argument(s) it accepts.Removes the plottable by its index. | |
| int | clearPlottables () |
| Removes all plottables from the plot (and the legend, if necessary). More... | |
| int | plottableCount () const |
| Returns the number of currently existing plottables in the plot. More... | |
| QList< QCPAbstractPlottable * > | selectedPlottables () const |
| Returns a list of the selected plottables. More... | |
| QCPAbstractPlottable * | plottableAt (const QPointF &pos, bool onlySelectable=false) const |
| Returns the plottable at the pixel position pos. More... | |
| bool | hasPlottable (QCPAbstractPlottable *plottable) const |
| Returns whether this QCustomPlot instance contains the plottable. More... | |
| QCPGraph * | graph (int index) const |
| Returns the graph with index. More... | |
| QCPGraph * | graph () const |
| This is an overloaded member function, provided for convenience. It differs from the above function only in what argument(s) it accepts.Returns the last graph, that was created with addGraph. More... | |
| QCPGraph * | addGraph (QCPAxis *keyAxis=0, QCPAxis *valueAxis=0) |
| Creates a new graph inside the plot. More... | |
| bool | removeGraph (QCPGraph *graph) |
| Removes the specified graph from the plot and, if necessary, from the legend. More... | |
| bool | removeGraph (int index) |
| This is an overloaded member function, provided for convenience. It differs from the above function only in what argument(s) it accepts.Removes the graph by its index. | |
| int | clearGraphs () |
| Removes all graphs from the plot (and the legend, if necessary). More... | |
| int | graphCount () const |
| Returns the number of currently existing graphs in the plot. More... | |
| QList< QCPGraph * > | selectedGraphs () const |
| Returns a list of the selected graphs. More... | |
| QCPAbstractItem * | item (int index) const |
| Returns the item with index. More... | |
| QCPAbstractItem * | item () const |
| This is an overloaded member function, provided for convenience. It differs from the above function only in what argument(s) it accepts.Returns the last item, that was added with addItem. More... | |
| bool | addItem (QCPAbstractItem *item) |
| Adds the specified item to the plot. More... | |
| bool | removeItem (QCPAbstractItem *item) |
| Removes the specified item from the plot. More... | |
| bool | removeItem (int index) |
| This is an overloaded member function, provided for convenience. It differs from the above function only in what argument(s) it accepts.Removes the item by its index. | |
| int | clearItems () |
| Removes all items from the plot. More... | |
| int | itemCount () const |
| Returns the number of currently existing items in the plot. More... | |
| QList< QCPAbstractItem * > | selectedItems () const |
| Returns a list of the selected items. More... | |
| QCPAbstractItem * | itemAt (const QPointF &pos, bool onlySelectable=false) const |
| Returns the item at the pixel position pos. More... | |
| QCPLayer * | layer (const QString &name) const |
| Returns the layer with the specified name. More... | |
| QCPLayer * | layer (int index) const |
| This is an overloaded member function, provided for convenience. It differs from the above function only in what argument(s) it accepts.Returns the layer by index. More... | |
| QCPLayer * | currentLayer () const |
| Returns the layer that is set as current layer (see setCurrentLayer). | |
| bool | setCurrentLayer (const QString &name) |
| Sets the layer with the specified name to be the current layer. More... | |
| bool | setCurrentLayer (QCPLayer *layer) |
| This is an overloaded member function, provided for convenience. It differs from the above function only in what argument(s) it accepts.Sets the provided layer to be the current layer. More... | |
| int | layerCount () const |
| Returns the number of currently existing layers in the plot. More... | |
| bool | addLayer (const QString &name, QCPLayer *otherLayer=0, LayerInsertMode insertMode=limAbove) |
| Adds a new layer to this QCustomPlot instance. More... | |
| bool | removeLayer (QCPLayer *layer) |
| Removes the specified layer and returns true on success. More... | |
| bool | moveLayer (QCPLayer *layer, QCPLayer *otherLayer, LayerInsertMode insertMode=limAbove) |
| Moves the specified layer to the position relative to otherLayer. More... | |
| QList< QCPAxis * > | selectedAxes () const |
| Returns the axes that currently have selected parts, i.e. More... | |
| QList< QCPLegend * > | selectedLegends () const |
| Returns the legends (typically one or zero) that currently have selected parts, i.e. More... | |
| void | setupFullAxesBox () |
| Convenience function to make the top and right axes visible and assign them the following properties from their corresponding bottom/left axes: More... | |
| bool | savePdf (const QString &fileName, bool noCosmeticPen=false, int width=0, int height=0) |
| Saves a PDF with the vectorized plot to the file fileName. More... | |
| bool | savePng (const QString &fileName, int width=0, int height=0, double scale=1.0, int quality=-1) |
| Saves a PNG image file to fileName on disc. More... | |
| bool | saveJpg (const QString &fileName, int width=0, int height=0, double scale=1.0, int quality=-1) |
| Saves a JPG image file to fileName on disc. More... | |
| bool | saveBmp (const QString &fileName, int width=0, int height=0, double scale=1.0) |
| Saves a BMP image file to fileName on disc. More... | |
| bool | saveRastered (const QString &fileName, int width, int height, double scale, const char *format, int quality=-1) |
| Saves the plot to a rastered image file fileName in the image format format. More... | |
Public Attributes | |
| QCPAxis * | xAxis |
| QCPAxis * | yAxis |
| QCPAxis * | xAxis2 |
| QCPAxis * | yAxis2 |
| QCPLegend * | legend |
Protected Member Functions | |
| virtual QSize | minimumSizeHint () const |
| virtual void | paintEvent (QPaintEvent *event) |
| virtual void | resizeEvent (QResizeEvent *event) |
| virtual void | mouseDoubleClickEvent (QMouseEvent *event) |
| virtual void | mousePressEvent (QMouseEvent *event) |
| virtual void | mouseMoveEvent (QMouseEvent *event) |
| virtual void | mouseReleaseEvent (QMouseEvent *event) |
| virtual void | wheelEvent (QWheelEvent *event) |
| virtual bool | handlePlottableSelection (QMouseEvent *event, bool additiveSelection, bool &modified) |
| virtual bool | handleItemSelection (QMouseEvent *event, bool additiveSelection, bool &modified) |
| virtual bool | handleAxisSelection (QMouseEvent *event, bool additiveSelection, bool &modified) |
| virtual bool | handleTitleSelection (QMouseEvent *event, bool additiveSelection, bool &modified) |
| virtual void | draw (QCPPainter *painter) |
| virtual void | drawAxisBackground (QCPPainter *painter) |
| void | updateAxisRect () |
| bool | selectTestTitle (const QPointF &pos) const |
Protected Attributes | |
| QString | mTitle |
| QFont | mTitleFont |
| QFont | mSelectedTitleFont |
| QColor | mTitleColor |
| QColor | mSelectedTitleColor |
| QRect | mViewport |
| QRect | mAxisRect |
| int | mMarginLeft |
| int | mMarginRight |
| int | mMarginTop |
| int | mMarginBottom |
| bool | mAutoMargin |
| bool | mAutoAddPlottableToLegend |
| QColor | mColor |
| QList< QCPAbstractPlottable * > | mPlottables |
| QList< QCPGraph * > | mGraphs |
| QList< QCPAbstractItem * > | mItems |
| QList< QCPLayer * > | mLayers |
| Qt::Orientations | mRangeDrag |
| Qt::Orientations | mRangeZoom |
| QCPAxis * | mRangeDragHorzAxis |
| QCPAxis * | mRangeDragVertAxis |
| QCPAxis * | mRangeZoomHorzAxis |
| QCPAxis * | mRangeZoomVertAxis |
| double | mRangeZoomFactorHorz |
| double | mRangeZoomFactorVert |
| bool | mDragging |
| QCP::AntialiasedElements | mAntialiasedElements |
| QCP::AntialiasedElements | mNotAntialiasedElements |
| QPixmap | mAxisBackground |
| bool | mAxisBackgroundScaled |
| Qt::AspectRatioMode | mAxisBackgroundScaledMode |
| Interactions | mInteractions |
| int | mSelectionTolerance |
| bool | mTitleSelected |
| QRect | mTitleBoundingBox |
| bool | mNoAntialiasingOnDrag |
| QPixmap | mPaintBuffer |
| QPoint | mDragStart |
| QCPRange | mDragStartHorzRange |
| QCPRange | mDragStartVertRange |
| QPixmap | mScaledAxisBackground |
| bool | mReplotting |
| QCP::AntialiasedElements | mAADragBackup |
| QCP::AntialiasedElements | mNotAADragBackup |
| QCPLayer * | mCurrentLayer |
| QCP::PlottingHints | mPlottingHints |
| Qt::KeyboardModifier | mMultiSelectModifier |
Friends | |
| class | QCPLegend |
| class | QCPAxis |
| class | QCPLayer |
The central class of the library, the QWidget which displays the plot and interacts with the user.
For tutorials on how to use QCustomPlot, see the website
http://www.WorksLikeClockWork.com/index.php/components/qt-plotting-widget
Defines the mouse interactions possible with QCustomPlot.
Interactions is a flag of or-combined elements of this enum type.
| Enumerator | |
|---|---|
| iRangeDrag |
|
| iRangeZoom |
|
| iMultiSelect |
|
| iSelectTitle |
|
| iSelectPlottables |
|
| iSelectAxes |
|
| iSelectLegend |
|
| iSelectItems |
|
|
explicit |
Constructs a QCustomPlot and sets reasonable default values.
Four axes are created at the bottom, left, top and right sides (xAxis, yAxis, xAxis2, yAxis2), however, only the bottom and left axes are set to be visible. The legend is also set to be invisible initially.
Creates a new graph inside the plot.
If keyAxis and valueAxis are left unspecified (0), the bottom (xAxis) is used as key and the left (yAxis) is used as value. If specified, keyAxis and valueAxis must reside in this QCustomPlot.
keyAxis will be used as key axis (typically "x") and valueAxis as value axis (typically "y") for the graph.
Returns a pointer to the newly created graph.
| bool QCPlot::QCustomPlot::addItem | ( | QCPAbstractItem * | item | ) |
Adds the specified item to the plot.
QCustomPlot takes ownership of the item.
Returns true on success, i.e. when item wasn't already added to the plot and the parent plot of item is this QCustomPlot.
| bool QCPlot::QCustomPlot::addLayer | ( | const QString & | name, |
| QCPLayer * | otherLayer = 0, |
||
| QCustomPlot::LayerInsertMode | insertMode = limAbove |
||
| ) |
Adds a new layer to this QCustomPlot instance.
The new layer will have the name name, which must be unique. It is positioned either below or above otherLayer, which can be controlled with insertMode.
Returns true on success, i.e. if there is no other layer named name and otherLayer is a valid layer inside this QCustomPlot.
If otherLayer is 0, the highest layer in the QCustomPlot will be used.
For an explanation of what layers are in QCustomPlot, see the documentation of QCPLayer.
| bool QCPlot::QCustomPlot::addPlottable | ( | QCPAbstractPlottable * | plottable | ) |
Adds the specified plottable to the plot and, if setAutoAddPlottableToLegend is enabled, to the legend.
QCustomPlot takes ownership of the plottable.
Returns true on success, i.e. when plottable wasn't already added to the plot and the parent plot of plottable is this QCustomPlot (the latter is controlled by what axes the plottable was passed in the constructor).
|
signal |
This signal is emitted immediately after a replot has taken place (caused by a call to the slot replot).
It is safe to mutually connect the replot slot with this signal on two QCustomPlots to make them replot synchronously (i.e. it won't cause an infinite recursion).
|
signal |
This signal is emitted when an axis is clicked.
event is the mouse event that caused the click, axis is the axis that received the click and part indicates the part of the axis that was clicked.
|
signal |
This signal is emitted when an axis is double clicked.
event is the mouse event that caused the click, axis is the axis that received the click and part indicates the part of the axis that was clicked.
|
signal |
This signal is emitted immediately before a replot takes place (caused by a call to the slot replot).
It is safe to mutually connect the replot slot with this signal on two QCustomPlots to make them replot synchronously (i.e. it won't cause an infinite recursion).
| int QCPlot::QCustomPlot::clearGraphs | ( | ) |
Removes all graphs from the plot (and the legend, if necessary).
Returns the number of graphs removed.
| int QCPlot::QCustomPlot::clearItems | ( | ) |
| int QCPlot::QCustomPlot::clearPlottables | ( | ) |
Removes all plottables from the plot (and the legend, if necessary).
Returns the number of plottables removed.
|
slot |
Deselects everything in the QCustomPlot (plottables, items, axes, legend and title).
Since calling this function is not a user interaction, this does not emit the selectionChangedByUser signal. The individual selectionChanged signals are emitted though, if the objects were previously selected.
| QCPGraph * QCPlot::QCustomPlot::graph | ( | int | index | ) | const |
Returns the graph with index.
If the index is invalid, returns 0.
There is an overloaded version of this function with no parameter which returns the last created graph, see QCustomPlot::graph()
| QCPGraph * QCPlot::QCustomPlot::graph | ( | ) | const |
This is an overloaded member function, provided for convenience. It differs from the above function only in what argument(s) it accepts.Returns the last graph, that was created with addGraph.
If there are no graphs in the plot, returns 0.
| int QCPlot::QCustomPlot::graphCount | ( | ) | const |
| bool QCPlot::QCustomPlot::hasPlottable | ( | QCPAbstractPlottable * | plottable | ) | const |
Returns whether this QCustomPlot instance contains the plottable.
| QCPAbstractItem * QCPlot::QCustomPlot::item | ( | int | index | ) | const |
Returns the item with index.
If the index is invalid, returns 0.
There is an overloaded version of this function with no parameter which returns the last added item, see QCustomPlot::item()
| QCPAbstractItem * QCPlot::QCustomPlot::item | ( | ) | const |
| QCPAbstractItem * QCPlot::QCustomPlot::itemAt | ( | const QPointF & | pos, |
| bool | onlySelectable = false |
||
| ) | const |
Returns the item at the pixel position pos.
Items that only consist of single lines (e.g. QCPItemLine or QCPItemCurve) have a tolerance band around them, see setSelectionTolerance. If multiple items come into consideration, the one closest to pos is returned.
If onlySelectable is true, only items that are selectable (QCPAbstractItem::setSelectable) are considered.
If there is no item at pos, the return value is 0.
|
signal |
This signal is emitted when an item is clicked.
event is the mouse event that caused the click and item is the item that received the click.
| int QCPlot::QCustomPlot::itemCount | ( | ) | const |
|
signal |
This signal is emitted when an item is double clicked.
event is the mouse event that caused the click and item is the item that received the click.
| QCPLayer * QCPlot::QCustomPlot::layer | ( | const QString & | name | ) | const |
Returns the layer with the specified name.
| QCPLayer * QCPlot::QCustomPlot::layer | ( | int | index | ) | const |
This is an overloaded member function, provided for convenience. It differs from the above function only in what argument(s) it accepts.Returns the layer by index.
| int QCPlot::QCustomPlot::layerCount | ( | ) | const |
|
signal |
This signal is emitted when a legend (item) is clicked.
event is the mouse event that caused the click, legend is the legend that received the click and item is the legend item that received the click. If only the legend and no item is clicked, item is 0 (e.g. a click inside the legend padding, which is not part of any item).
|
signal |
This signal is emitted when a legend (item) is double clicked.
event is the mouse event that caused the click, legend is the legend that received the click and item is the legend item that received the click. If only the legend and no item is clicked, item is 0 (e.g. a click inside the legend padding, which is not part of any item).
|
signal |
This signal is emitted when the QCustomPlot receives a mouse move event.
It is emitted before the QCustomPlot handles its range dragging mechanism, so a slot connected to this signal can still influence the behaviour e.g. with setRangeDrag.
|
signal |
This signal is emitted when the QCustomPlot receives a mouse press event.
It is emitted before the QCustomPlot handles its range dragging mechanism, so a slot connected to this signal can still influence the behaviour e.g. with setRangeDrag or setRangeDragAxes.
|
signal |
This signal is emitted when the QCustomPlot receives a mouse release event.
It is emitted before the QCustomPlot handles its selection mechanism, so a slot connected to this signal can still influence the behaviour e.g. with setInteractions or QCPAbstractPlottable::setSelectable.
|
signal |
This signal is emitted when the QCustomPlot receives a mouse wheel event.
It is emitted before the QCustomPlot handles its range zooming mechanism, so a slot connected to this signal can still influence the behaviour e.g. with setRangeZoom, setRangeZoomAxes or setRangeZoomFactor.
| bool QCPlot::QCustomPlot::moveLayer | ( | QCPLayer * | layer, |
| QCPLayer * | otherLayer, | ||
| QCustomPlot::LayerInsertMode | insertMode = limAbove |
||
| ) |
Moves the specified layer to the position relative to otherLayer.
Whether layer is placed above or below otherLayer can be controlled with insertMode.
Returns true on success, i.e. when both layer and otherLayer are valid layers in the QCustomPlot.
| QCPAbstractPlottable * QCPlot::QCustomPlot::plottable | ( | int | index | ) |
Returns the plottable with index.
If the index is invalid, returns 0.
There is an overloaded version of this function with no parameter which returns the last added plottable, see QCustomPlot::plottable()
| QCPAbstractPlottable * QCPlot::QCustomPlot::plottable | ( | ) |
This is an overloaded member function, provided for convenience. It differs from the above function only in what argument(s) it accepts.Returns the last plottable, that was added with addPlottable.
If there are no plottables in the plot, returns 0.
| QCPAbstractPlottable * QCPlot::QCustomPlot::plottableAt | ( | const QPointF & | pos, |
| bool | onlySelectable = false |
||
| ) | const |
Returns the plottable at the pixel position pos.
Plottables that only consist of single lines (e.g. graphs) have a tolerance band around them, see setSelectionTolerance. If multiple plottables come into consideration, the one closest to pos is returned.
If onlySelectable is true, only plottables that are selectable (QCPAbstractPlottable::setSelectable) are considered.
If there is no plottable at pos, the return value is 0.
|
signal |
This signal is emitted when a plottable is clicked.
event is the mouse event that caused the click and plottable is the plottable that received the click.
| int QCPlot::QCustomPlot::plottableCount | ( | ) | const |
Returns the number of currently existing plottables in the plot.
|
signal |
This signal is emitted when a plottable is double clicked.
event is the mouse event that caused the click and plottable is the plottable that received the click.
| QCPAxis * QCPlot::QCustomPlot::rangeDragAxis | ( | Qt::Orientation | orientation | ) |
Returns the range drag axis of the orientation provided.
| QCPAxis * QCPlot::QCustomPlot::rangeZoomAxis | ( | Qt::Orientation | orientation | ) |
Returns the range zoom axis of the orientation provided.
| double QCPlot::QCustomPlot::rangeZoomFactor | ( | Qt::Orientation | orientation | ) |
Returns the range zoom factor of the orientation provided.
| bool QCPlot::QCustomPlot::removeGraph | ( | QCPGraph * | graph | ) |
Removes the specified graph from the plot and, if necessary, from the legend.
If any other graphs in the plot have a channel fill set towards the removed graph, the channel fill property of those graphs is reset to zero (no channel fill).
Returns true on success.
| bool QCPlot::QCustomPlot::removeItem | ( | QCPAbstractItem * | item | ) |
| bool QCPlot::QCustomPlot::removeLayer | ( | QCPLayer * | layer | ) |
Removes the specified layer and returns true on success.
All layerables (e.g. plottables and items) on the removed layer will be moved to the layer below layer. If layer is the bottom layer, the layerables are moved to the layer above. In both cases, the total rendering order of all layerables in the QCustomPlot is preserved.
If layer is the current layer (setCurrentLayer), the layer below (or above, if bottom layer) becomes the new current layer.
Note that it is not possible to remove the last layer.
| bool QCPlot::QCustomPlot::removePlottable | ( | QCPAbstractPlottable * | plottable | ) |
Removes the specified plottable from the plot and, if necessary, from the legend.
Returns true on success.
|
slot |
Causes a complete replot (axes, labels, graphs, etc.) into the internal buffer.
Finally, update() is called, to redraw the buffer on the QCustomPlot widget surface.
Before the replot happens, the signal beforeReplot is emitted. After the replot, afterReplot is emitted. It is safe to mutually connect the replot slot with any of those two signals on two QCustomPlots to make them replot synchronously (i.e. it won't cause an infinite recursion).
|
slot |
Rescales the axes such that all plottables (e.g.
graphs) in the plot are fully visible. It does this by calling QCPAbstractPlottable::rescaleAxes on all plottables.
| bool QCPlot::QCustomPlot::saveBmp | ( | const QString & | fileName, |
| int | width = 0, |
||
| int | height = 0, |
||
| double | scale = 1.0 |
||
| ) |
Saves a BMP image file to fileName on disc.
The output plot will have the dimensions width and height in pixels. If either width or height is zero, the exported image will have the same dimensions as the QCustomPlot widget currently has. Line widths and texts etc. are not scaled up when larger widths/heights are used. If you want that effect, use the scale parameter.
For example, if you set both width and height to 100 and scale to 2, you will end up with an image file of size 200*200 in which all graphical elements are scaled up by factor 2 (line widths, texts, etc.). This scaling is not done by stretching a 100*100 image, the result will have full 200*200 pixel resolution.
The objects of the plot will appear in the current selection state. If you don't want any selected objects to be painted in their selected look, deselect everything with deselectAll before calling this function.
Returns true on success. If this function fails, most likely the BMP format isn't supported by the system, see Qt docs about QImageWriter::supportedImageFormats().
| bool QCPlot::QCustomPlot::saveJpg | ( | const QString & | fileName, |
| int | width = 0, |
||
| int | height = 0, |
||
| double | scale = 1.0, |
||
| int | quality = -1 |
||
| ) |
Saves a JPG image file to fileName on disc.
The output plot will have the dimensions width and height in pixels. If either width or height is zero, the exported image will have the same dimensions as the QCustomPlot widget currently has. Line widths and texts etc. are not scaled up when larger widths/heights are used. If you want that effect, use the scale parameter.
For example, if you set both width and height to 100 and scale to 2, you will end up with an image file of size 200*200 in which all graphical elements are scaled up by factor 2 (line widths, texts, etc.). This scaling is not done by stretching a 100*100 image, the result will have full 200*200 pixel resolution.
The objects of the plot will appear in the current selection state. If you don't want any selected objects to be painted in their selected look, deselect everything with deselectAll before calling this function.
JPG compression can be controlled with the quality parameter which must be between 0 and 100 or -1 to use the default setting.
Returns true on success. If this function fails, most likely the JPG format isn't supported by the system, see Qt docs about QImageWriter::supportedImageFormats().
| bool QCPlot::QCustomPlot::savePdf | ( | const QString & | fileName, |
| bool | noCosmeticPen = false, |
||
| int | width = 0, |
||
| int | height = 0 |
||
| ) |
Saves a PDF with the vectorized plot to the file fileName.
The axis ratio as well as the scale of texts and lines will be derived from the specified width and height. This means, the output will look like the normal on-screen output of a QCustomPlot widget with the corresponding pixel width and height. If either width or height is zero, the exported image will have the same dimensions as the QCustomPlot widget currently has.
noCosmeticPen disables the use of cosmetic pens when drawing to the PDF file. Cosmetic pens are pens with numerical width 0, which are always drawn as a one pixel wide line, no matter what zoom factor is set in the PDF-Viewer. For more information about cosmetic pens, see QPainter and QPen documentation.
The objects of the plot will appear in the current selection state. So when you don't want e.g. selected axes to be painted in their selected look, deselect everything with deselectAll before calling this function.
Returns true on success.
| bool QCPlot::QCustomPlot::savePng | ( | const QString & | fileName, |
| int | width = 0, |
||
| int | height = 0, |
||
| double | scale = 1.0, |
||
| int | quality = -1 |
||
| ) |
Saves a PNG image file to fileName on disc.
The output plot will have the dimensions width and height in pixels. If either width or height is zero, the exported image will have the same dimensions as the QCustomPlot widget currently has. Line widths and texts etc. are not scaled up when larger widths/heights are used. If you want that effect, use the scale parameter.
For example, if you set both width and height to 100 and scale to 2, you will end up with an image file of size 200*200 in which all graphical elements are scaled up by factor 2 (line widths, texts, etc.). This scaling is not done by stretching a 100*100 image, the result will have full 200*200 pixel resolution.
The objects of the plot will appear in the current selection state. If you don't want any selected objects to be painted in their selected look, deselect everything with deselectAll before calling this function.
If you want the plot to be painted in a PNG with transparent background, call setColor with a transparent color, e.g. Qt::transparent, before saving.
PNG compression can be controlled with the quality parameter which must be between 0 and 100 or -1 to use the default setting.
Returns true on success. If this function fails, most likely the PNG format isn't supported by the system, see Qt docs about QImageWriter::supportedImageFormats().
| bool QCPlot::QCustomPlot::saveRastered | ( | const QString & | fileName, |
| int | width, | ||
| int | height, | ||
| double | scale, | ||
| const char * | format, | ||
| int | quality = -1 |
||
| ) |
Saves the plot to a rastered image file fileName in the image format format.
The plot is sized to width and height in pixels and scaled with scale. (width 100 and scale 2.0 lead to a full resolution file with width 200) If the format supports compression, quality may be between 0 and 100 to control it.
Returns true on success. If this function fails, most likely the given format isn't supported by the system, see Qt docs about QImageWriter::supportedImageFormats().
| QList< QCPAxis * > QCPlot::QCustomPlot::selectedAxes | ( | ) | const |
Returns the axes that currently have selected parts, i.e.
whose selection is not QCPAxis::spNone.
| QList< QCPGraph * > QCPlot::QCustomPlot::selectedGraphs | ( | ) | const |
Returns a list of the selected graphs.
If no graphs are currently selected, the list is empty.
| QList< QCPAbstractItem * > QCPlot::QCustomPlot::selectedItems | ( | ) | const |
Returns a list of the selected items.
If no items are currently selected, the list is empty.
| QList< QCPLegend * > QCPlot::QCustomPlot::selectedLegends | ( | ) | const |
Returns the legends (typically one or zero) that currently have selected parts, i.e.
whose selection is not QCPLegend::spNone.
| QList< QCPAbstractPlottable * > QCPlot::QCustomPlot::selectedPlottables | ( | ) | const |
Returns a list of the selected plottables.
If no plottables are currently selected, the list is empty.
There is a convenience function if you're only interested in selected graphs, see selectedGraphs.
|
signal |
This signal is emitted after the user has changed the selection in the QCustomPlot, e.g.
by clicking. It is not emitted, when the selection state of an object has changed programmatically, e.g. by a direct call to setSelected() on a plottable or by calling deselectAll.
See the documentation of setInteractions for how to find out which objects are currently selected.
| void QCPlot::QCustomPlot::setAntialiasedElement | ( | QCP::AntialiasedElement | antialiasedElement, |
| bool | enabled = true |
||
| ) |
Sets whether the specified antialiasedElement is forcibly drawn antialiased.
This overrides the antialiasing settings for whole element groups, normally controlled with the setAntialiasing function on the individual elements. If an element is neither specified in setAntialiasedElements nor in setNotAntialiasedElements, the antialiasing setting on each individual element instance is used.
For example, if enabled is true and antialiasedElement is QCP::aePlottables, all plottables will be drawn antialiased, no matter what the specific QCPAbstractPlottable::setAntialiased value was set to.
| void QCPlot::QCustomPlot::setAntialiasedElements | ( | const QCP::AntialiasedElements & | antialiasedElements | ) |
Sets which elements are forcibly drawn antialiased as an or combination of QCP::AntialiasedElement.
This overrides the antialiasing settings for whole element groups, normally controlled with the setAntialiasing function on the individual elements. If an element is neither specified in setAntialiasedElements nor in setNotAntialiasedElements, the antialiasing setting on each individual element instance is used.
For example, if antialiasedElements contains QCP::aePlottables, all plottables will be drawn antialiased, no matter what the specific QCPAbstractPlottable::setAntialiased value was set to.
| void QCPlot::QCustomPlot::setAutoAddPlottableToLegend | ( | bool | on | ) |
If set to true, adding a plottable (e.g.
a graph) to the QCustomPlot automatically also adds the newly created plottable to the legend.
| void QCPlot::QCustomPlot::setAutoMargin | ( | bool | enabled | ) |
Sets whether the margins are calculated automatically depeding on the sizes of the tick labels, axis labels, paddings etc.
If disabled, the margins must be set manually with the setMargin functions.
| void QCPlot::QCustomPlot::setAxisBackground | ( | const QPixmap & | pm | ) |
Sets pm as the axis background pixmap.
The axis background pixmap will be drawn inside the current axis rect, before anything else (e.g. the axes themselves, grids, graphs, etc.) is drawn. If the provided pixmap doesn't have the same size as the axis rect, scaling can be enabled with setAxisBackgroundScaled and the scaling mode (i.e. whether and how the aspect ratio is preserved) can be set with setAxisBackgroundScaledMode. To set all these options in one call, consider using the overloaded version of this function.
| void QCPlot::QCustomPlot::setAxisBackground | ( | const QPixmap & | pm, |
| bool | scaled, | ||
| Qt::AspectRatioMode | mode = Qt::KeepAspectRatioByExpanding |
||
| ) |
This is an overloaded member function, provided for convenience. It differs from the above function only in what argument(s) it accepts. Allows setting the background pixmap, whether it shall be scaled and how it shall be scaled in one call.
| void QCPlot::QCustomPlot::setAxisBackgroundScaled | ( | bool | scaled | ) |
Sets whether the axis background pixmap shall be scaled to fit the current axis rect or not.
If scaled is set to true, you may control whether and how the aspect ratio of the original pixmap is preserved with setAxisBackgroundScaledMode.
Note that the scaled version of the original pixmap is buffered, so there is no performance penalty on replots, when enabling the scaling. (Except of course, the axis rect is continuously changed, but that's not very likely.)
| void QCPlot::QCustomPlot::setAxisBackgroundScaledMode | ( | Qt::AspectRatioMode | mode | ) |
If scaling of the axis background pixmap is enabled (setAxisBackgroundScaled), use this function to define whether and how the aspect ratio of the original pixmap passed to setAxisBackground is preserved.
| void QCPlot::QCustomPlot::setAxisRect | ( | const QRect & | arect | ) |
An alternative way to set the margins, by directly setting the wanted axis rect.
The rect will be translated into appropriate margin values.
| bool QCPlot::QCustomPlot::setCurrentLayer | ( | const QString & | name | ) |
Sets the layer with the specified name to be the current layer.
All newly created/added layerables (QCPLayerable), e.g. plottables and items, are initially placed on the current layer.
Returns true on success, i.e. if there is a layer with the specified name in the QCustomPlot.
| bool QCPlot::QCustomPlot::setCurrentLayer | ( | QCPLayer * | layer | ) |
This is an overloaded member function, provided for convenience. It differs from the above function only in what argument(s) it accepts.Sets the provided layer to be the current layer.
Returns true on success, i.e. when layer is a valid layer in the QCustomPlot.
| void QCPlot::QCustomPlot::setInteraction | ( | const Interaction & | interaction, |
| bool | enabled = true |
||
| ) |
Sets the single interaction of this QCustomPlot to enabled.
For details about the interaction system, see setInteractions.
| void QCPlot::QCustomPlot::setInteractions | ( | const Interactions & | interactions | ) |
Sets the possible interactions of this QCustomPlot as an or-combination of Interaction enums.
There are the following types of interactions:
Axis range manipulation is controlled via iRangeDrag and iRangeZoom. When the respective interaction is enabled, the user may drag axes ranges and zoom with the mouse wheel. For details how to control which axes the user may drag/zoom and in what orientations, see setRangeDrag, setRangeZoom, setRangeDragAxes, setRangeZoomAxes.
Plottable selection is controlled by iSelectPlottables. If iSelectPlottables is set, the user may select plottables (e.g. graphs, curves, bars,...) by clicking on them or in their vicinity, see setSelectionTolerance. Whether the user can actually select a plottable can further be restricted with the QCPAbstractPlottable::setSelectable function on the specific plottable. To find out whether a specific plottable is selected, call QCPAbstractPlottable::selected(). To retrieve a list of all currently selected plottables, call selectedPlottables. If you're only interested in QCPGraphs, you may use the convenience function selectedGraphs.
Item selection is controlled by iSelectItems. If iSelectItems is set, the user may select items (e.g. QCPItemLine, QCPItemText,...) by clicking on them or in their vicinity. To find out whether a specific item is selected, call QCPAbstractItem::selected(). To retrieve a list of all currently selected items, call selectedItems.
Axis selection is controlled with iSelectAxes. If iSelectAxes is set, the user may select parts of the axes by clicking on them. What parts exactly (e.g. Axis base line, tick labels, axis label) are selectable can be controlled via QCPAxis::setSelectable for each axis. To retrieve a list of all axes that currently contain selected parts, call selectedAxes. Which parts of an axis are selected, can be retrieved with QCPAxis::selected().
Legend selection is controlled with iSelectLegend. If this is set, the user may select the legend itself or individual items by clicking on them. What parts exactly are selectable can be controlled via QCPLegend::setSelectable. To find out whether the legend or any child items are selected, check the value of QCPLegend::selected. To find out which child items are selected, call QCPLegend::selectedItems.
Plot title selection is controlled with iSelectTitle. If set, the user may select the plot title by clicking on it. To find out whether the title is currently selected, call QCustomPlot::titleSelected().
If the selection state has changed by user interaction, the selectionChangedByUser signal is emitted. Each selectable object additionally emits an individual selectionChanged signal whenever their selection state has changed, i.e. not only by user interaction.
To allow multiple objects to be selected by holding the modifier set with setMultiSelectModifier, set the flag iMultiSelect.
| void QCPlot::QCustomPlot::setMargin | ( | int | left, |
| int | right, | ||
| int | top, | ||
| int | bottom | ||
| ) |
Sets the margins manually.
Will only have effect, if setAutoMargin is set to false. The margins are the distances in pixels between the axes box and the viewport box. The viewport box normally is the entire QCustomPlot widget or the entire image, if using one of the export functions. Positive margin values always mean the axes box is shrinked, going inward from the sides of the viewport box.
| void QCPlot::QCustomPlot::setMarginBottom | ( | int | margin | ) |
Sets the bottom margin manually.
Will only have effect, if setAutoMargin is set to false. see setMargin for an explanation of what margins mean in QCustomPlot.
| void QCPlot::QCustomPlot::setMarginLeft | ( | int | margin | ) |
Sets the left margin manually.
Will only have effect, if setAutoMargin is set to false. see setMargin for an explanation of what margins mean in QCustomPlot.
| void QCPlot::QCustomPlot::setMarginRight | ( | int | margin | ) |
Sets the right margin manually.
Will only have effect, if setAutoMargin is set to false. see setMargin for an explanation of what margins mean in QCustomPlot.
| void QCPlot::QCustomPlot::setMarginTop | ( | int | margin | ) |
Sets the top margin manually.
Will only have effect, if setAutoMargin is set to false. see setMargin for an explanation of what margins mean in QCustomPlot.
| void QCPlot::QCustomPlot::setMultiSelectModifier | ( | Qt::KeyboardModifier | modifier | ) |
Sets the keyboard modifier that will be recognized as multi-select-modifier.
If iMultiSelect is specified in setInteractions, the user may select multiple objects by clicking on them one after the other while holding down modifier.
By default the multi-select-modifier is set to Qt::ControlModifier.
| void QCPlot::QCustomPlot::setNoAntialiasingOnDrag | ( | bool | enabled | ) |
Sets whether antialiasing is disabled for all elements while the user is dragging axes ranges.
If many objects, especially plottables, are normally drawn antialiased, this greatly improves performance during dragging. Thus it creates a more responsive user experience. As soon as the user stops dragging, the last replot is done with normal antialiasing, to restore high image quality.
| void QCPlot::QCustomPlot::setNotAntialiasedElement | ( | QCP::AntialiasedElement | notAntialiasedElement, |
| bool | enabled = true |
||
| ) |
Sets whether the specified notAntialiasedElement is forcibly drawn not antialiased.
This overrides the antialiasing settings for whole element groups, normally controlled with the setAntialiasing function on the individual elements. If an element is neither specified in setAntialiasedElements nor in setNotAntialiasedElements, the antialiasing setting on each individual element instance is used.
For example, if enabled is true and notAntialiasedElement is QCP::aePlottables, no plottables will be drawn antialiased, no matter what the specific QCPAbstractPlottable::setAntialiased value was set to.
if enabled is true and notAntialiasedElement is already set with setAntialiasedElement, it is removed from there.
| void QCPlot::QCustomPlot::setNotAntialiasedElements | ( | const QCP::AntialiasedElements & | notAntialiasedElements | ) |
Sets which elements are forcibly drawn not antialiased as an or combination of QCP::AntialiasedElement.
This overrides the antialiasing settings for whole element groups, normally controlled with the setAntialiasing function on the individual elements. If an element is neither specified in setAntialiasedElements nor in setNotAntialiasedElements, the antialiasing setting on each individual element instance is used.
For example, if notAntialiasedElements contains QCP::aePlottables, no plottables will be drawn antialiased, no matter what the specific QCPAbstractPlottable::setAntialiased value was set to.
if an element in notAntialiasedElements is already set in setAntialiasedElements, it is removed from there.
| void QCPlot::QCustomPlot::setPlottingHint | ( | QCP::PlottingHint | hint, |
| bool | enabled = true |
||
| ) |
Sets the specified plotting hint to enabled.
| void QCPlot::QCustomPlot::setPlottingHints | ( | const QCP::PlottingHints & | hints | ) |
Sets the plotting hints for this QCustomPlot instance.
| void QCPlot::QCustomPlot::setRangeDrag | ( | Qt::Orientations | orientations | ) |
Sets which axis orientation may be range dragged by the user with mouse interaction.
What orientation corresponds to which specific axis can be set with setRangeDragAxes(QCPAxis *horizontal, QCPAxis *vertical). By default, the horizontal axis is the bottom axis (xAxis) and the vertical axis is the left axis (yAxis).
To disable range dragging entirely, pass 0 as orientations or remove iRangeDrag from setInteractions. To enable range dragging for both directions, pass Qt::Horizontal | Qt::Vertical as orientations.
In addition to setting orientations to a non-zero value, make sure setInteractions contains iRangeDrag to enable the range dragging interaction.
Sets the axes whose range will be dragged when setRangeDrag enables mouse range dragging on the QCustomPlot widget.
| void QCPlot::QCustomPlot::setRangeZoom | ( | Qt::Orientations | orientations | ) |
Sets which axis orientation may be zoomed by the user with the mouse wheel.
What orientation corresponds to which specific axis can be set with setRangeZoomAxes(QCPAxis *horizontal, QCPAxis *vertical). By default, the horizontal axis is the bottom axis (xAxis) and the vertical axis is the left axis (yAxis).
To disable range zooming entirely, pass 0 as orientations or remove iRangeZoom from setInteractions. To enable range zooming for both directions, pass Qt::Horizontal | Qt::Vertical as orientations.
In addition to setting orientations to a non-zero value, make sure setInteractions contains iRangeZoom to enable the range zooming interaction.
Sets the axes whose range will be zoomed when setRangeZoom enables mouse wheel zooming on the QCustomPlot widget.
The two axes can be zoomed with different strengths, when different factors are passed to setRangeZoomFactor(double horizontalFactor, double verticalFactor).
| void QCPlot::QCustomPlot::setRangeZoomFactor | ( | double | horizontalFactor, |
| double | verticalFactor | ||
| ) |
Sets how strong one rotation step of the mouse wheel zooms, when range zoom was activated with setRangeZoom.
The two parameters horizontalFactor and verticalFactor provide a way to let the horizontal axis zoom at different rates than the vertical axis. Which axis is horizontal and which is vertical, can be set with setRangeZoomAxes.
When the zoom factor is greater than one, scrolling the mouse wheel backwards (towards the user) will zoom in (make the currently visible range smaller). For zoom factors smaller than one, the same scrolling direction will zoom out.
| void QCPlot::QCustomPlot::setSelectedTitleColor | ( | const QColor & | color | ) |
This color is used to draw the title, when it is selected.
| void QCPlot::QCustomPlot::setSelectedTitleFont | ( | const QFont & | font | ) |
This font is used to draw the title, when it is selected.
| void QCPlot::QCustomPlot::setSelectionTolerance | ( | int | pixels | ) |
Sets the tolerance that is used when deciding whether a click on the QCustomPlot surface selects an object (e.g.
a plottable) or not.
If for example the user clicks in the vicinity of the line of a QCPGraph, it's only regarded as a potential selection when the minimum distance between the click position and the graph line is smaller than pixels. Objects that are defined by an area (e.g. QCPBars) only react to clicks directly inside the area and ignore this selection tolerance. In other words it only has meaning for parts of objects that are too thin to exactly hit with a click and thus need such a tolerance.
| void QCPlot::QCustomPlot::setTitle | ( | const QString & | title | ) |
Sets the plot title which will be drawn centered at the top of the widget.
The title position is not dependant on the actual position of the axes. However, if setAutoMargin is set to true, the top margin will be adjusted appropriately, so the top axis labels/tick labels will not overlap with the title.
| void QCPlot::QCustomPlot::setTitleColor | ( | const QColor & | color | ) |
Sets the text color of the plot title.
| void QCPlot::QCustomPlot::setTitleFont | ( | const QFont & | font | ) |
Sets the font of the plot title.
| void QCPlot::QCustomPlot::setTitleSelected | ( | bool | selected | ) |
Sets whether the plot title is selected.
| void QCPlot::QCustomPlot::setupFullAxesBox | ( | ) |
Convenience function to make the top and right axes visible and assign them the following properties from their corresponding bottom/left axes:
Tick labels (QCPAxis::setTickLabels) however, is always set to false.
This function does not connect the rangeChanged signals of the bottom and left axes to the QCPAxis::setRange slots of the top and right axes in order to synchronize the ranges permanently.
|
signal |
This signal is emitted when the plot title is clicked.
event is the mouse event that caused the click.
|
signal |
This signal is emitted when the plot title is double clicked.
event is the mouse event that caused the click.
|
inline |
Returns the viewport rect of this QCustomPlot instance.
The viewport is the area the plot is drawn in, all mechanisms, e.g. margin caluclation take the viewport to be the outer border of the plot. The viewport normally is the rect() of the QCustomPlot widget, i.e. a rect with top left (0, 0) and size of the QCustomPlot widget.
Don't confuse the viewport with the axisRect. An axisRect is the rect defined by two axes, where the graphs/plottables are drawn in. The viewport is larger and contains also the axes themselves, their tick numbers, their labels, the plot title etc.
Only when saving to a file (see savePng, savePdf etc.) the viewport is temporarily modified to allow saving plots with sizes independent of the current widget size.
 1.8.5
1.8.5

